Table of Contents
Mars Weather Reports
| This webpage will soon be converted to be the top level page for Mars Weather Reports. It will contain links to the sub-pages, the clocks, the current location of Mars graphic and other data not spcific to the weather readings. The sub-pages will display the weather data from Insight, Curiosity and Perseverance. |
These reports are provided by NASA's InSight lander in the south-west corner of Elysium Planitia. Daily readings are usually a couple of days behind reality.
This page is updated as new data is detected. InSight is no longer transmitting weather data. See InSight's Final Selfie
Last update: 14:02 Sun. Jul 17th, 2022 BST
Mars experiments are currently in send-only mode during the Mars solar conjunction. Follow this link to see daily updates during the conjunction.
If the image doesn't display, please wait. The NASA websites sometimes get busy.
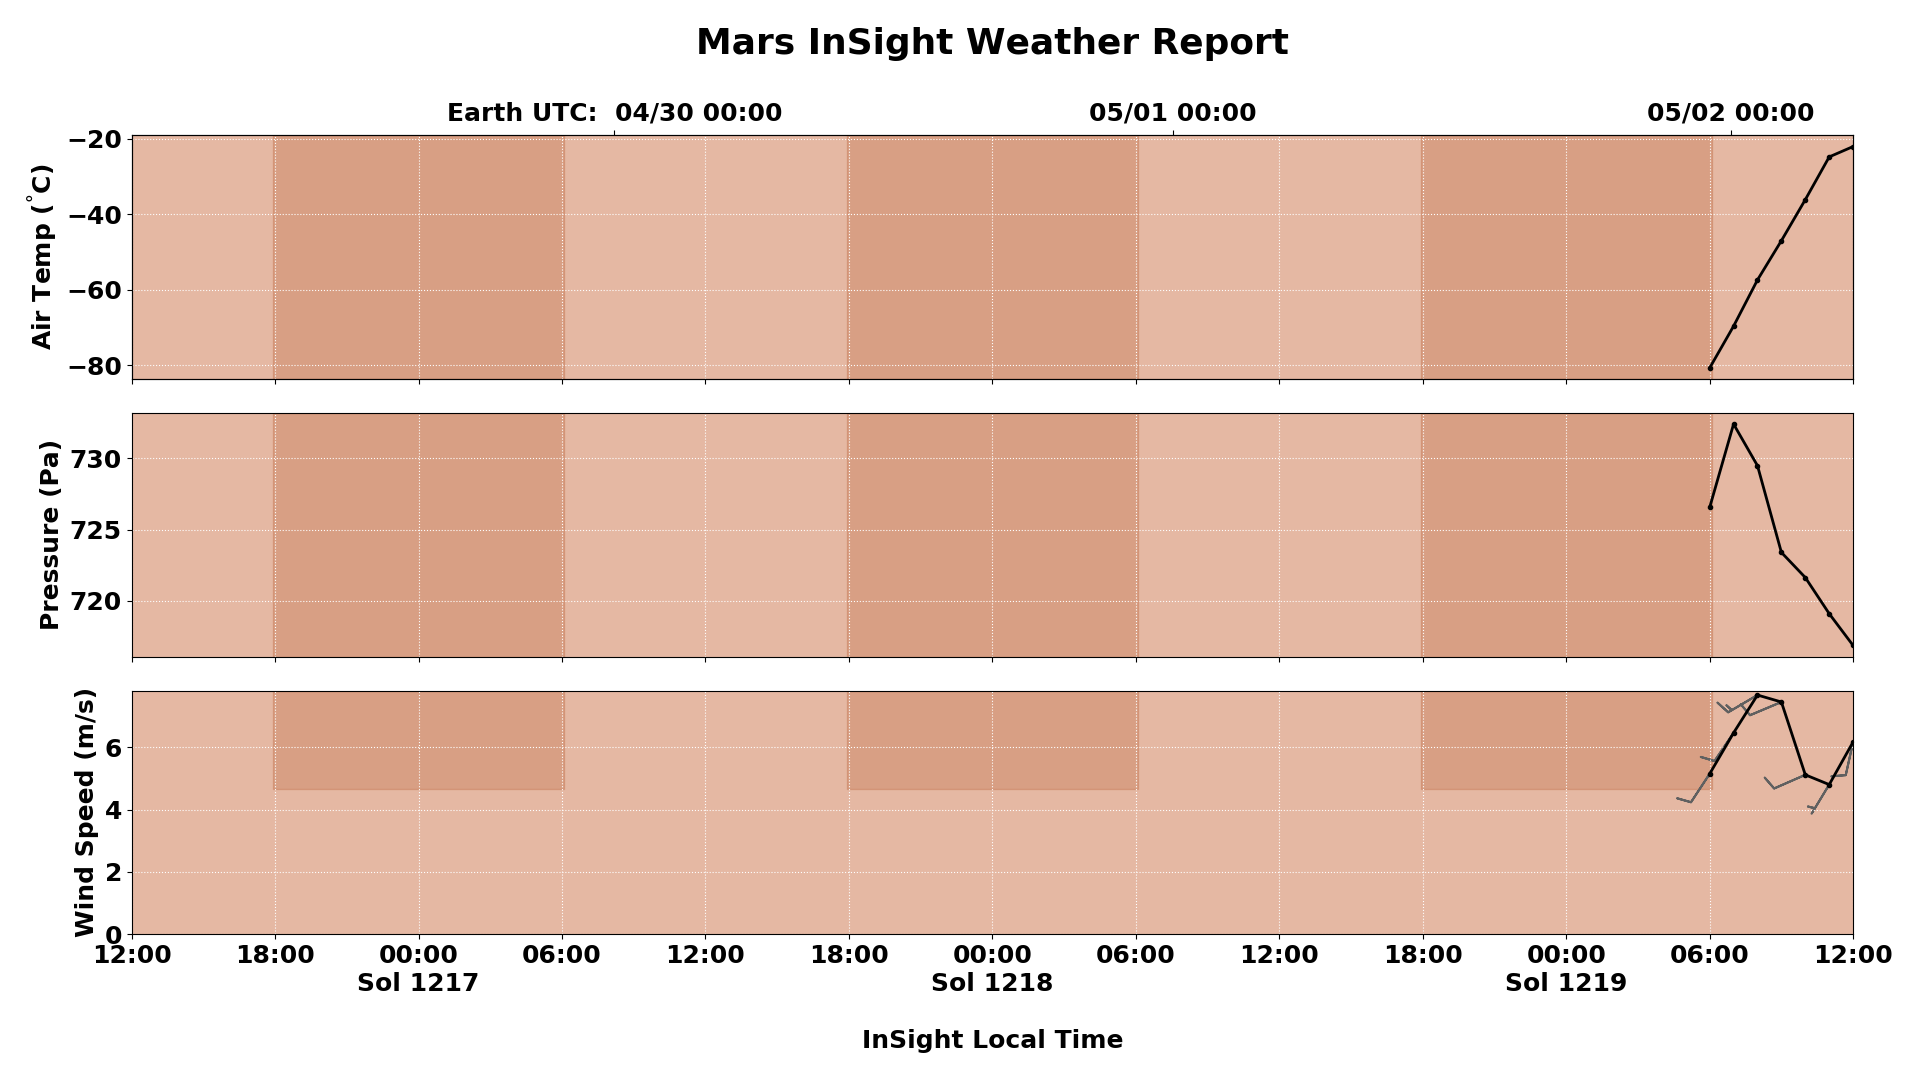
Explanation of the Wind Speed Chart
Wind speed is shown in meters per second, as measured by the pair of TWINS booms. The barbs extending from each wind speed data point indicate the compass direction of the wind (e.g., a wind blowing from the north will have a barb straight up above the point; a wind blowing from the west will have a barb off to the left). Full and half flags extending from the barbs indicate the wind speed, with each half flag representing approximately 2.5 meters per second. A circle in place of a barb indicates a wind speed less than 2.5 meters per second.
Full details can be seen at https://mars.nasa.gov/insight/weather/
Images Courtesy of NASA/JPL-Caltech/Cornell/CAB
 Note: There is a discrepancy between the summary data and the charts provided by NASA (good on you if you spotted this - if not, go hunt the thimble!). I've notified them and hopefully they'll do something about it.
Wind Speed
To put wind speed in perspective, the dust on Mars is talcum-powder fine. It requires a wind speed of 64kph (~40mph) to pick it up. 64kph equates to approximately 17.78m/s. The air is incredibly thin, just 0.06% the density of Earth's atmosphere at sea level, so it takes a high wind speed to generate enough Newtons to pick even these tiny particles up.
Typical air pressure on Earth is around 1000mb = 1bar = 100,000 pascals.
Martian Day
The Martian day is 39 mins 35.244 secs longer than a standard day. This means that approx every 36.1 days the Earth date skips a day while the Martian Sol marches on as normal. You can see this in the data below. April 16th 2019 seems to be missing, yet the Sols on April 15th and April 17th are consecutive.
Wind Distribution Graphs
Wind distribution graphs indicate from which directions wind was most prevalent during the course of a day. You can select from the last 30 days worth of data (first detailed wind direction data is for sol 539).
Click Sol to plot its Wind Direction distribution: Values in the graph indicate the number of times the wind was recorded blowing from a particular direction (±11.25°). You can move your mouse over the shaded areas for a little more interaction (t=direction, r=number of samples).
Historical Data
Data gathered from the NASA servers may be subject to corrections based on newer data. This is performed by NASA, not me. Any data that is within the last 7 data-rows is within the frame that may be updated. Any updates are automatically applied to the tables below, and all charts and derived tables (such as the record high and low temperatures) are updated accordingly.
Some tables show results after smoothing the data to remove anomolies. I have clearly marked all data that has been smoothed so there is no ambiguity. The method of smoothing out the anomolies is simple and efficient, although not guaranteed to remove them all. Essentially, if a temperature reading is ≥±10°C from the previous valid reading, it's probably an anomoly and is rejected.
A more thorough breakdown of records in °C and °F can be found after the Temperature Over Time Chart.
| Records (after smoothing out anomolies) | ||||||
|---|---|---|---|---|---|---|
| Temp | Date | Sol | Season | Season Start | Season End | |
| Highest | 1.6 C | June 3, 2020 | 540 | Autumn | Apr 8, 2020 | Sep 1, 2020 |
| Lowest | -105.6 C | June 14, 2019 | 195 | Spring | Mar 23, 2019 | Oct 7, 2019 |
| Time | Air Temperature (°C) | Wind Speed (m/s) | Pressure (Pa) | ||||||||
|---|---|---|---|---|---|---|---|---|---|---|---|
| Date | Sol | Max | Avg | Min | Max | Avg | Min | Direction | Max | Avg | Min |
| Dec. 28, 2021 | 1098 | -12.1 C | -60.6 C | -93.4 C | 19.3 | 5.2 | 0.3 | W | 637.5 | 619.8 | 593.3 |
| Dec. 17, 2021 | 1087 | -13 C | -55.6 C | -94 C | 19.4 | 5.3 | 0.3 | S | 632.3 | 620.4 | 602.7 |
| Dec. 16, 2021 | 1086 | -10.2 C | -61.6 C | -95.1 C | 20.5 | 4.3 | 0.3 | W | 631.6 | 620.3 | 602.7 |
| Dec. 10, 2021 | 1081 | -13.1 C | -55.4 C | -118.9 C | 17.4 | 5.2 | 0.3 | S | 637.2 | 620.6 | 606.6 |
| Time | Air Temperature (°C) | Wind Speed (m/s) | Pressure (Pa) | ||||||||
|---|---|---|---|---|---|---|---|---|---|---|---|
| Date | Sol | Max | Avg | Min | Max | Avg | Min | Direction | Max | Avg | Min |
| Apr. 28, 2021 | 861 | - | - | - | - | - | - | n/a | 755 | 744.4 | 726.6 |
| Apr. 25, 2021 | 858 | - | - | - | - | - | - | n/a | 755 | 740.5 | 725.1 |
| Apr. 23, 2021 | 856 | - | - | - | - | - | - | n/a | 753.3 | 742.1 | 723.3 |
| Apr. 22, 2021 | 855 | - | - | - | - | - | - | n/a | 752.7 | 741.1 | 723.2 |
| Apr. 21, 2021 | 854 | - | - | - | - | - | - | n/a | 754.7 | 746.1 | 719 |
| Apr. 16, 2021 | 849 | - | - | - | - | - | - | n/a | 751.5 | 739.3 | 719.1 |
| Apr. 15, 2021 | 848 | - | - | - | - | - | - | n/a | 750.5 | 739.7 | 719.5 |
| Apr. 12, 2021 | 845 | - | - | - | - | - | - | n/a | 750.3 | 743.1 | 727.6 |
| Apr. 9, 2021 | 842 | - | - | - | - | - | - | n/a | 750.6 | 738.5 | 718.5 |
| Apr. 8, 2021 | 841 | - | - | - | - | - | - | n/a | 750.4 | 737.4 | 718.5 |
| Apr. 7, 2021 | 840 | - | - | - | - | - | - | n/a | 749.4 | 737.3 | 718.1 |
| Apr. 5, 2021 | 838 | - | - | - | - | - | - | n/a | 749.4 | 733.2 | 716.7 |
| Apr. 3, 2021 | 836 | - | - | - | - | - | - | n/a | 749.6 | 736.6 | 716.1 |
| Apr. 2, 2021 | 835 | - | - | - | - | - | - | n/a | 747.3 | 733.8 | 716.8 |
| Apr. 1, 2021 | 834 | - | - | - | - | - | - | n/a | 747.9 | 736.6 | 714.6 |
| Time | Air Temperature (°C) | Wind Speed (m/s) | Pressure (Pa) | ||||||||
|---|---|---|---|---|---|---|---|---|---|---|---|
| Date | Sol | Max | Avg | Min | Max | Avg | Min | Direction | Max | Avg | Min |
| Mar. 31, 2021 | 833 | - | - | - | - | - | - | n/a | 747.5 | 733.4 | 714.8 |
| Mar. 30, 2021 | 832 | - | - | - | - | - | - | n/a | 748.8 | 734.3 | 714.6 |
| Mar. 26, 2021 | 828 | - | - | - | - | - | - | n/a | 744.6 | 730.1 | 713.4 |
| Mar. 21, 2021 | 824 | - | - | - | - | - | - | n/a | 745.8 | 731.5 | 710.1 |
| Mar. 18, 2021 | 821 | - | - | - | - | - | - | n/a | 744.2 | 729.6 | 710.1 |
| Mar. 17, 2021 | 820 | - | - | - | - | - | - | n/a | 742.9 | 729.3 | 709.8 |
| Mar. 16, 2021 | 819 | - | - | - | - | - | - | n/a | 744.5 | 730.4 | 709.8 |
| Mar. 15, 2021 | 818 | - | - | - | - | - | - | n/a | 743.9 | 727.7 | 710.2 |
| Mar. 12, 2021 | 815 | - | - | - | - | - | - | n/a | 744.9 | 728.4 | 708.4 |
| Mar. 11, 2021 | 814 | - | - | - | - | - | - | n/a | 745.5 | 728.1 | 706.9 |
| Mar. 10, 2021 | 813 | - | - | - | - | - | - | n/a | 743.9 | 727.9 | 706.2 |
| Mar. 9, 2021 | 812 | - | - | - | - | - | - | n/a | 742.9 | 727.7 | 706.4 |
| Mar. 8, 2021 | 811 | - | - | - | - | - | - | n/a | 745.7 | 728.2 | 707.2 |
| Mar. 7, 2021 | 810 | - | - | - | - | - | - | n/a | 744.4 | 728.1 | 707.3 |
| Mar. 6, 2021 | 809 | - | - | - | - | - | - | n/a | 744.9 | 727.6 | 706.7 |
| Mar. 5, 2021 | 808 | - | - | - | - | - | - | n/a | 746.7 | 728.2 | 707.3 |
| Mar. 4, 2021 | 807 | - | - | - | - | - | - | n/a | 745.1 | 728 | 707.7 |
| Mar. 3, 2021 | 806 | - | - | - | - | - | - | n/a | 742.6 | 723.6 | 705.5 |
| Mar. 2, 2021 | 805 | - | - | - | - | - | - | n/a | 741.9 | 722.1 | 703.6 |
| Mar. 1, 2021 | 804 | - | - | - | - | - | - | n/a | 741.4 | 721.6 | 704.4 |
| Time | Air Temperature (°C) | Wind Speed (m/s) | Pressure (Pa) | ||||||||
|---|---|---|---|---|---|---|---|---|---|---|---|
| Date | Sol | Max | Avg | Min | Max | Avg | Min | Direction | Max | Avg | Min |
| Feb. 12, 2021 | 788 | - | - | - | - | - | - | n/a | 741.2 | 721.9 | 700 |
| Feb. 11, 2021 | 787 | - | - | - | - | - | - | n/a | 741.3 | 722.2 | 699.1 |
| Feb. 10, 2021 | 786 | - | - | - | - | - | - | n/a | 743.6 | 721.4 | 698.8 |
| Feb. 9, 2021 | 785 | - | - | - | - | - | - | n/a | 742.3 | 720.6 | 698.2 |
| Feb. 8, 2021 | 784 | - | - | - | - | - | - | n/a | 742 | 720.8 | 696.7 |
| Feb. 7, 2021 | 783 | - | - | - | - | - | - | n/a | 743.2 | 722.2 | 698.8 |
| Feb. 6, 2021 | 782 | - | - | - | - | - | - | n/a | 742.3 | 721.8 | 698.8 |
| Feb. 5, 2021 | 781 | - | - | - | - | - | - | n/a | 742.8 | 717.4 | 695.3 |
| Feb. 4, 2021 | 780 | - | - | - | - | - | - | n/a | 741.1 | 718 | 693.7 |
| Feb. 3, 2021 | 779 | - | - | - | - | - | - | n/a | 741.2 | 721.7 | 695.4 |
| Feb. 2, 2021 | 778 | - | - | - | - | - | - | n/a | 739.5 | 718.4 | 695.5 |
| Time | Air Temperature (°C) | Wind Speed (m/s) | Pressure (Pa) | ||||||||
|---|---|---|---|---|---|---|---|---|---|---|---|
| Date | Sol | Max | Avg | Min | Max | Avg | Min | Direction | Max | Avg | Min |
| Jan. 23, 2021 | 768 | - | - | - | - | - | - | n/a | 739.3 | 718.2 | 695.9 |
| Jan. 22, 2021 | 767 | - | - | - | - | - | - | n/a | 736.6 | 715.9 | 692.1 |
| Jan. 21, 2021 | 766 | - | - | - | - | - | - | n/a | 734.5 | 713.6 | 691.3 |
| Jan. 20, 2021 | 765 | - | - | - | - | - | - | n/a | 736 | 717.4 | 692.2 |
| Jan. 19, 2021 | 764 | - | - | - | - | - | - | n/a | 736.3 | 714.1 | 692.9 |
| Jan. 18, 2021 | 763 | - | - | - | - | - | - | n/a | 734.8 | 715 | 690.3 |
| Jan. 17, 2021 | 762 | - | - | - | - | - | - | n/a | 735 | 713.5 | 690 |
| Jan. 16, 2021 | 761 | - | - | - | - | - | - | n/a | 736.2 | 713.3 | 691.4 |
| Jan. 15, 2021 | 760 | - | - | - | - | - | - | n/a | 736 | 716.7 | 692.2 |
| Jan. 14, 2021 | 759 | - | - | - | - | - | - | n/a | 734.5 | 715.8 | 691.9 |
| Jan. 13, 2021 | 758 | - | - | - | - | - | - | n/a | 733.9 | 714.6 | 691.5 |
| Jan. 12, 2021 | 757 | -8.1 C | -36.1 C | -48.7 C | 13.9 | 4.3 | 0.3 | SW | 734 | 717.1 | 692.6 |
| Jan. 11, 2021 | 756 | - | - | - | - | - | - | n/a | 732.2 | 713.4 | 692 |
| Jan. 9, 2021 | 755 | -7.5 C | -56.8 C | -94.8 C | 13.1 | 4.1 | 0.2 | SW | - | - | - |
| Jan. 7, 2021 | 753 | - | - | - | - | - | - | n/a | 735.4 | 715.6 | 690.4 |
| Jan. 6, 2021 | 752 | - | - | - | - | - | - | n/a | 736 | 715.4 | 691.2 |
| Jan. 5, 2021 | 751 | - | - | - | - | - | - | n/a | 734.9 | 714.6 | 690.6 |
| Jan. 4, 2021 | 750 | - | - | - | - | - | - | n/a | 738.1 | 717.5 | 693.3 |
| Jan. 3, 2021 | 749 | - | - | - | - | - | - | n/a | 737.1 | 717.6 | 691.9 |
| Jan. 2, 2021 | 748 | - | - | - | - | - | - | n/a | 733.1 | 710.7 | 688.9 |
| Jan. 1, 2021 | 747 | - | - | - | - | - | - | n/a | 735.7 | 716 | 690.3 |
| Time | Air Temperature (°C) | Wind Speed (m/s) | Pressure (Pa) | ||||||||
|---|---|---|---|---|---|---|---|---|---|---|---|
| Date | Sol | Max | Avg | Min | Max | Avg | Min | Direction | Max | Avg | Min |
| Dec. 31, 2020 | 746 | - | - | - | - | - | - | n/a | 732.5 | 715.9 | 692.2 |
| Dec. 30, 2020 | 745 | - | - | - | - | - | - | n/a | 732.3 | 714.7 | 689.8 |
| Dec. 29, 2020 | 744 | - | - | - | - | - | - | n/a | 734.6 | 718.6 | 692.4 |
| Dec. 28, 2020 | 743 | - | - | - | - | - | - | n/a | 735.4 | 716.2 | 691.4 |
| Dec. 27, 2020 | 742 | - | - | - | - | - | - | n/a | 735.6 | 720.1 | 691.6 |
| Dec. 26, 2020 | 741 | -4.1 C | -53.7 C | -94.5 C | 12.9 | 4.3 | 0.2 | SW | 737 | 716 | 692.5 |
| Dec. 25, 2020 | 740 | -2.3 C | -62.3 C | -94.1 C | 13.5 | 4.2 | 0.2 | WNW | 734.2 | 715.6 | 688.1 |
| Dec. 24, 2020 | 739 | -12.5 C | -57.5 C | -94.3 C | 14.6 | 4.8 | 0.3 | WNW | 739.2 | 718.7 | 693.1 |
| Dec. 23, 2020 | 738 | -9.2 C | -66.7 C | -93.9 C | 16.2 | 4.9 | 0.3 | WNW | 737.4 | 719.4 | 689.7 |
| Dec. 22, 2020 | 737 | -7.6 C | -60.7 C | -93.7 C | 15.1 | 4.7 | 0.2 | WNW | 743 | 721.9 | 693.5 |
| Dec. 21, 2020 | 736 | -8.8 C | -67.6 C | -94.5 C | 14.6 | 3.7 | 0.2 | WNW | 739.6 | 720.4 | 690 |
| Dec. 3, 2020 | 719 | - | - | - | - | - | - | n/a | 749.1 | 718.1 | 686.3 |
| Dec. 2, 2020 | 718 | - | - | - | - | - | - | n/a | 749.8 | 722.4 | 688.4 |
| Dec. 1, 2020 | 717 | - | - | - | - | - | - | n/a | 751.6 | 722.5 | 689 |
| Time | Air Temperature (°C) | Wind Speed (m/s) | Pressure (Pa) | ||||||||
|---|---|---|---|---|---|---|---|---|---|---|---|
| Date | Sol | Max | Avg | Min | Max | Avg | Min | Direction | Max | Avg | Min |
| Nov. 30, 2020 | 716 | - | - | - | - | - | - | n/a | 749.2 | 723.4 | 689.5 |
| Nov. 29, 2020 | 715 | - | - | - | - | - | - | n/a | 747.7 | 724.9 | 691 |
| Nov. 27, 2020 | 713 | - | - | - | - | - | - | n/a | 748.2 | 725.2 | 690.5 |
| Nov. 26, 2020 | 712 | - | - | - | - | - | - | n/a | 749 | 724.6 | 688.8 |
| Nov. 25, 2020 | 711 | - | - | - | - | - | - | n/a | 749.9 | 723.4 | 683.4 |
| Nov. 24, 2020 | 710 | - | - | - | - | - | - | n/a | 756.7 | 723.9 | 681.3 |
| Nov. 23, 2020 | 709 | - | - | - | - | - | - | n/a | 760.7 | 734.3 | 678.8 |
| Nov. 22, 2020 | 708 | -8.2 C | -62.2 C | -93.2 C | 20.2 | 6 | 0.2 | W | 769.2 | 733.7 | 675.5 |
| Nov. 21, 2020 | 707 | -7.6 C | -66 C | -93.1 C | 16 | 5.3 | 0.2 | W | 768.4 | 736.4 | 674.4 |
| Nov. 20, 2020 | 706 | -11.3 C | -60.3 C | -93.1 C | 13.1 | 4.4 | 0.2 | WNW | 764.3 | 731.1 | 678.5 |
| Nov. 19, 2020 | 705 | -9.1 C | -61.9 C | -94.6 C | 16.4 | 4.4 | 0.2 | WNW | 766.2 | 732 | 686.9 |
| Nov. 18, 2020 | 704 | -8.2 C | -62.8 C | -97.1 C | 14.1 | 4.4 | 0.2 | W | 766.3 | 735.1 | 693.9 |
| Nov. 17, 2020 | 703 | -8.9 C | -62.2 C | -96 C | 21.2 | 5.8 | 0.2 | W | 768 | 737.9 | 698.8 |
| Nov. 15, 2020 | 701 | - | - | - | - | - | - | n/a | 755.2 | 730.3 | 704.7 |
| Nov. 14, 2020 | 700 | -13.2 C | -62.9 C | -96.6 C | 20.9 | 5.7 | 0.2 | WNW | 760.9 | 735.9 | 708.7 |
| Nov. 13, 2020 | 699 | -9.9 C | -62.7 C | -97.8 C | 14.2 | 4.2 | 0.1 | WNW | 753.6 | 731.8 | 705.2 |
| Nov. 12, 2020 | 698 | -14.6 C | -69.5 C | -96.4 C | 23.7 | 6.2 | 0.4 | W | 757.1 | 736.8 | 708.1 |
| Nov. 11, 2020 | 697 | - | - | - | - | - | - | n/a | 754.1 | 732.9 | 710.5 |
| Nov. 10, 2020 | 696 | - | - | - | - | - | - | n/a | 756.1 | 734.6 | 706.9 |
| Nov. 9, 2020 | 695 | -11.8 C | -60 C | -96.4 C | - | - | - | n/a | 757.1 | 738 | 713.9 |
| Nov. 8, 2020 | 694 | -9.5 C | -56.8 C | -104.7 C | - | - | - | n/a | 753.7 | 734.6 | 710 |
| Nov. 7, 2020 | 693 | -12.4 C | -67 C | -96.7 C | 21.9 | 6.4 | 0.3 | WNW | 759.1 | 738.6 | 713.2 |
| Nov. 6, 2020 | 692 | -10.5 C | -66 C | -96.8 C | 21.4 | 5.7 | 0.2 | W | 754.6 | 737.1 | 711.6 |
| Nov. 5, 2020 | 691 | -16.1 C | -61.3 C | -97 C | 22 | 7.5 | 0.8 | WNW | 758.4 | 740.8 | 713.1 |
| Nov. 4, 2020 | 690 | -14.8 C | -66.7 C | -96.8 C | 22.7 | 7.5 | 0.9 | WNW | 756.5 | 742.1 | 715.2 |
| Nov. 3, 2020 | 689 | -18.4 C | -56.2 C | -96.8 C | 25.7 | 8.5 | 1.3 | WNW | 763.6 | 742.6 | 716 |
| Nov. 2, 2020 | 688 | -12.8 C | -67.3 C | -95.7 C | 17.2 | 5.5 | 0.2 | WNW | 758.6 | 743.7 | 717.5 |
| Nov. 1, 2020 | 687 | - | - | - | - | - | - | n/a | 755.6 | 738.6 | 714 |
| Time | Air Temperature (°C) | Wind Speed (m/s) | Pressure (Pa) | ||||||||
|---|---|---|---|---|---|---|---|---|---|---|---|
| Date | Sol | Max | Avg | Min | Max | Avg | Min | Direction | Max | Avg | Min |
| Oct. 31, 2020 | 686 | - | - | - | - | - | - | n/a | 756.9 | 743.5 | 717.9 |
| Oct. 30, 2020 | 685 | -11.9 C | -57.7 C | -97.2 C | 18.3 | 6 | 0.2 | WNW | 757.6 | 739.5 | 715.8 |
| Oct. 29, 2020 | 684 | -17.9 C | -62.4 C | -95.5 C | - | - | - | n/a | 762.1 | 744.1 | 718.7 |
| Oct. 25, 2020 | 681 | -4.4 C | -62.4 C | -95.4 C | 18.6 | 5.6 | 0.2 | WNW | 760.2 | 743.6 | 718.5 |
| Oct. 20, 2020 | 676 | -16.5 C | -66.8 C | -96.9 C | 26.9 | 8.9 | 1.1 | W | 767.1 | 750.3 | 722.6 |
| Oct. 19, 2020 | 675 | -15.9 C | -63.3 C | -96.9 C | 22.5 | 7.3 | 1.1 | WNW | 768.8 | 751.5 | 722.8 |
| Oct. 18, 2020 | 674 | -7.4 C | -57.6 C | -96 C | 18.5 | 5.4 | 0.2 | WNW | 765 | 746.6 | 722.4 |
| Oct. 17, 2020 | 673 | -9.9 C | -62.4 C | -96.7 C | 18.9 | 5.6 | 0.2 | WNW | 766.4 | 747.7 | 721.1 |
| Oct. 16, 2020 | 672 | -6.5 C | -67.5 C | -96.8 C | 16 | 4.7 | 0.2 | WNW | 766.2 | 749.1 | 723.3 |
| Oct. 15, 2020 | 671 | -8.5 C | -62.8 C | -96 C | 19.1 | 5.7 | 0.2 | WNW | 764.1 | 748.3 | 722.8 |
| Oct. 14, 2020 | 670 | -15.8 C | -60.7 C | -95.8 C | 23.1 | 7.9 | 0.5 | WNW | 771.5 | 750.9 | 723.9 |
| Oct. 13, 2020 | 669 | -15.9 C | -64.6 C | -95.6 C | 22.3 | 8 | 0.5 | WNW | 770.5 | 755.7 | 724.3 |
| Oct. 12, 2020 | 668 | -15 C | -59.9 C | -96.8 C | 22.1 | 7.4 | 0.3 | WNW | 770.3 | 753 | 727.1 |
| Oct. 11, 2020 | 667 | -9.2 C | -65 C | -96.8 C | 18.1 | 6 | 0.3 | W | 768.7 | 754.1 | 726.2 |
| Oct. 10, 2020 | 666 | -14.1 C | -59.6 C | -96.5 C | 20.4 | 6.1 | 0.3 | WNW | 771.2 | 749.6 | 726.2 |
| Oct. 9, 2020 | 665 | -10.8 C | -65.6 C | -95.9 C | 15 | 5.3 | 0.3 | WNW | 766.4 | 751.2 | 728 |
| Oct. 8, 2020 | 664 | -10.8 C | -57.4 C | -96.4 C | 18.6 | 6 | 0.2 | WNW | 771.6 | 753.2 | 726.9 |
| Oct. 7, 2020 | 663 | -16.6 C | -62.4 C | -96.7 C | 23.4 | 8 | 0.8 | WNW | 775.2 | 756.9 | 728.8 |
| Oct. 6, 2020 | 662 | -15.3 C | -62.9 C | -97.1 C | 22.5 | 8 | 0.3 | WNW | 777.4 | 758.5 | 729.5 |
| Oct. 5, 2020 | 661 | -13.4 C | -61.4 C | -96.5 C | 21.6 | 6.6 | 0.2 | WNW | 775.5 | 757.7 | 731.4 |
| Oct. 4, 2020 | 660 | -10.7 C | -63.2 C | -96 C | 17.2 | 5.3 | 0.3 | WNW | 773.8 | 755.8 | 728.2 |
| Oct. 3, 2020 | 659 | -10.8 C | -62.8 C | -96.5 C | 16.2 | 5.1 | 0.2 | WNW | 777.9 | 757.9 | 729 |
| Oct. 2, 2020 | 658 | -14.6 C | -64.2 C | -96.6 C | 21.6 | 5.4 | 0.2 | WNW | 776.3 | 758 | 730 |
| Oct. 1, 2020 | 657 | -18 C | -63.3 C | -97.2 C | 23.1 | 7.9 | 0.5 | WNW | 781.2 | 760.2 | 731.9 |
| Time | Air Temperature (°C) | Wind Speed (m/s) | Pressure (Pa) | ||||||||
|---|---|---|---|---|---|---|---|---|---|---|---|
| Date | Sol | Max | Avg | Min | Max | Avg | Min | Direction | Max | Avg | Min |
| Sep. 30, 2020 | 656 | -19.6 C | -63.9 C | -97.3 C | 21.9 | 8.6 | 1.1 | WNW | 783 | 765.1 | 735.9 |
| Sep. 29, 2020 | 655 | -18 C | -63.5 C | -95.3 C | 21.2 | 8.6 | 1.5 | WNW | 783.3 | 766.1 | 734.2 |
| Sep. 28, 2020 | 654 | -15.5 C | -62.9 C | -95.8 C | 20.8 | 6.8 | 0.8 | WNW | 779.4 | 763.2 | 735.7 |
| Sep. 27, 2020 | 653 | -10.6 C | -68.3 C | -96.3 C | 18 | 6 | 0.2 | W | 780.8 | 763.7 | 735.6 |
| Sep. 26, 2020 | 652 | -15.6 C | -63.4 C | -96.1 C | 18.6 | 6.4 | 0.3 | WNW | 779.1 | 762.2 | 734.8 |
| Sep. 25, 2020 | 651 | -15.9 C | -62 C | -96.7 C | 20.3 | 7 | 0.2 | WNW | 781.5 | 764.7 | 736.8 |
| Sep. 24, 2020 | 650 | -17.5 C | -62.3 C | -95.9 C | 22.8 | 8.3 | 1.6 | WNW | 785.6 | 768.2 | 737.7 |
| Sep. 23, 2020 | 649 | -19.2 C | -63.1 C | -95.7 C | 22 | 8.4 | 1.6 | WNW | 785.1 | 768 | 739.1 |
| Sep. 22, 2020 | 648 | -16.9 C | -59.4 C | -97.1 C | 20.3 | 8 | 1.9 | WNW | 786.8 | 766.5 | 739.6 |
| Sep. 21, 2020 | 647 | -14.9 C | -56.3 C | -96.1 C | 18.5 | 7 | 0.8 | WNW | 785 | 764.7 | 738.2 |
| Sep. 19, 2020 | 646 | -15.6 C | -55.5 C | -96 C | 18.9 | 7.2 | 0.8 | WNW | 785.7 | 764.8 | 738.1 |
| Sep. 18, 2020 | 645 | -15.2 C | -67.4 C | -95.6 C | 19.3 | 7.1 | 0.2 | WNW | 787.4 | 770.7 | 740.8 |
| Sep. 17, 2020 | 644 | -14.3 C | -69 C | -96 C | 18.7 | 6.2 | 0.2 | WNW | 785.7 | 769.5 | 738.8 |
| Sep. 16, 2020 | 643 | -15 C | -62 C | -95.7 C | 19.9 | 7.2 | 0.5 | WNW | 790.2 | 768.6 | 738.8 |
| Sep. 15, 2020 | 642 | -15.6 C | -62.3 C | -94.7 C | 19 | 7.2 | 0.7 | WNW | 788.9 | 769.8 | 740.2 |
| Sep. 14, 2020 | 641 | -12.6 C | -62.2 C | -95.4 C | 16.8 | 5.9 | 0.2 | WNW | 791.1 | 770.3 | 739.8 |
| Sep. 13, 2020 | 640 | -7.4 C | -68.5 C | -94.8 C | 15.9 | 5 | 0.2 | WNW | 791.2 | 773.3 | 741.9 |
| Sep. 12, 2020 | 639 | -10.4 C | -61 C | -95.6 C | 16.6 | 5.1 | 0.2 | WNW | 791.4 | 771 | 740.6 |
| Sep. 11, 2020 | 638 | -14.9 C | -62.5 C | -94.7 C | - | - | - | n/a | 791.2 | 771.6 | 741.5 |
| Sep. 9, 2020 | 636 | -17.1 C | -61.5 C | -94.6 C | 20.9 | 7.2 | 0.5 | WNW | 793.1 | 774.2 | 743.4 |
| Sep. 8, 2020 | 635 | -16.5 C | -62.3 C | -95.2 C | 20.7 | 7.8 | 0.5 | WNW | 795.7 | 776.2 | 745.1 |
| Sep. 7, 2020 | 634 | -16.1 C | -61.1 C | -94.6 C | 17.9 | 6.7 | 0.5 | WNW | 793.7 | 775.8 | 746.4 |
| Time | Air Temperature (°C) | Wind Speed (m/s) | Pressure (Pa) | ||||||||
|---|---|---|---|---|---|---|---|---|---|---|---|
| Date | Sol | Max | Avg | Min | Max | Avg | Min | Direction | Max | Avg | Min |
| Aug. 15, 2020 | 611 | -15.9 C | -61.3 C | -93.8 C | 18 | 7.3 | 0.3 | WNW | 807.5 | 788.3 | 756 |
| Aug. 13, 2020 | 610 | -16.8 C | -62.4 C | -93.8 C | 16.6 | 6.7 | 0.2 | WNW | 809 | 790.6 | 754.8 |
| Aug. 12, 2020 | 609 | -18.2 C | -62.2 C | -93.4 C | 20.1 | 7.8 | 0.5 | WNW | 810.8 | 790.4 | 754.2 |
| Aug. 11, 2020 | 608 | -19.5 C | -62.5 C | -93 C | 23.8 | 8.5 | 1.8 | WNW | 811.9 | 791 | 754.3 |
| Aug. 10, 2020 | 607 | -18.9 C | -64.3 C | -93.1 C | 21.4 | 8.2 | 1.6 | WNW | 809.8 | 788.4 | 753.8 |
| Aug. 9, 2020 | 606 | -18.7 C | -61.7 C | -94.1 C | 23.9 | 8 | 0.8 | WNW | 809.7 | 790.7 | 753 |
| Aug. 8, 2020 | 605 | -18.4 C | -65.7 C | -92.7 C | 22.5 | 8.3 | 1.9 | WNW | 811.5 | 790.4 | 756.8 |
| Aug. 7, 2020 | 604 | -16.3 C | -57.8 C | -91.5 C | 20.2 | 8.2 | 0.5 | WNW | 810 | 788.5 | 756.2 |
| Aug. 6, 2020 | 603 | -42.4 C | -70.9 C | -114 C | 17.2 | 6.6 | 0.2 | WNW | 811.1 | 791.6 | 754.7 |
| Aug. 5, 2020 | 602 | -9.5 C | -58.3 C | -91.5 C | 17 | 5.3 | 0.2 | WNW | 807.1 | 787.1 | 753.7 |
| Aug. 4, 2020 | 601 | -10.6 C | -57.9 C | -91.6 C | 16 | 5.4 | 0.2 | WNW | 809.4 | 783.8 | 751.6 |
| Aug. 3, 2020 | 600 | -5.7 C | -55 C | -107.6 C | 15.2 | 5.6 | 0.2 | W | 809.1 | 788.1 | 753.8 |
| Aug. 2, 2020 | 599 | -42.6 C | -75.9 C | -91.8 C | 15.6 | 5.1 | 0.2 | WNW | 806.3 | 787.5 | 751.1 |
| Aug. 1, 2020 | 598 | -15.1 C | -61 C | -91.6 C | 19.2 | 6.7 | 0.2 | WNW | 804 | 784.9 | 751.6 |
| Time | Air Temperature (°C) | Wind Speed (m/s) | Pressure (Pa) | ||||||||
|---|---|---|---|---|---|---|---|---|---|---|---|
| Date | Sol | Max | Avg | Min | Max | Avg | Min | Direction | Max | Avg | Min |
| July 31, 2020 | 597 | -16.9 C | -61.9 C | -91 C | 20.2 | 7.8 | 0.7 | WNW | 807.5 | 787.8 | 753.6 |
| July 30, 2020 | 596 | -15.4 C | -65.1 C | -90.7 C | 19.9 | 7.7 | 0.3 | WNW | 805.8 | 790.3 | 755.4 |
| July 29, 2020 | 595 | -12.9 C | -66.3 C | -91.9 C | 18.2 | 7 | 0.5 | WNW | 807.9 | 790.9 | 753.7 |
| July 28, 2020 | 594 | -16.6 C | -59.5 C | -91.8 C | 20.7 | 7.8 | 1.6 | WNW | 806.5 | 785.1 | 751.5 |
| July 27, 2020 | 593 | -16 C | -61 C | -91.8 C | 18.8 | 6.7 | 0.2 | WNW | 806.3 | 784.8 | 751.2 |
| July 26, 2020 | 592 | -15.1 C | -62 C | -92 C | 17.8 | 7 | 0.3 | WNW | 805.9 | 787.1 | 750.9 |
| July 25, 2020 | 591 | -15.5 C | -60.3 C | -91.2 C | 19 | 7.5 | 0.2 | WNW | 808.7 | 786.4 | 750.6 |
| July 24, 2020 | 590 | -13.8 C | -59.5 C | -90 C | 17.9 | 6.6 | 0.2 | WNW | 807.6 | 785.5 | 748.7 |
| July 23, 2020 | 589 | -13.1 C | -57.8 C | -90.1 C | 16.1 | 5.6 | 0.2 | WNW | 806.8 | 783.5 | 747.9 |
| July 22, 2020 | 588 | -11 C | -59.8 C | -89.2 C | 18.9 | 5.6 | 0.2 | WNW | 805.1 | 783.7 | 745.4 |
| July 21, 2020 | 587 | -9.8 C | -60.4 C | -89.2 C | 14.1 | 5 | 0.2 | WNW | 804.3 | 780.7 | 744.7 |
| July 20, 2020 | 586 | -7.1 C | -59.5 C | -131.8 C | 13.2 | 3.8 | 0.2 | WNW | 804.6 | 782.1 | 742.3 |
| July 19, 2020 | 585 | -12 C | -54.9 C | -89.2 C | 18.9 | 5.8 | 0.2 | W | 804 | 779.2 | 742.7 |
| July 18, 2020 | 584 | -12.3 C | -57.4 C | -89.1 C | 16 | 5.8 | 0.2 | WNW | 805 | 780.7 | 742.9 |
| July 17, 2020 | 583 | -7.2 C | -63 C | -89 C | 13.4 | 5.2 | 0.2 | WNW | 802.7 | 779 | 741.3 |
| July 16, 2020 | 582 | -4.6 C | -59.1 C | -89.1 C | 13.7 | 4.7 | 0.2 | WNW | 800.9 | 779.3 | 740.5 |
| July 15, 2020 | 581 | -10.1 C | -56.6 C | -88.7 C | 16.2 | 6 | 0.2 | WNW | 802.4 | 777.1 | 740 |
| July 14, 2020 | 580 | -8.4 C | -59.6 C | -88.8 C | 15.4 | 6 | 0.2 | WNW | 801.1 | 776.7 | 740.3 |
| July 13, 2020 | 579 | -3.7 C | -57.4 C | -88.5 C | 14.8 | 4.8 | 0.2 | WNW | 798.3 | 776 | 737.9 |
| July 12, 2020 | 578 | -5.2 C | -60.1 C | -88.3 C | 13.4 | 4.9 | 0.2 | WNW | 799.1 | 776.5 | 736.6 |
| Time | Air Temperature (°C) | Wind Speed (m/s) | Pressure (Pa) | ||||||||
|---|---|---|---|---|---|---|---|---|---|---|---|
| Date | Sol | Max | Avg | Min | Max | Avg | Min | Direction | Max | Avg | Min |
| June 29, 2020 | 566 | -4.2 C | -57.1 C | -88.4 C | 16.8 | 5.1 | 0.2 | WNW | 800.6 | 766.9 | 721.1 |
| June 28, 2020 | 565 | -5 C | -56.4 C | -89.6 C | 17.6 | 4.5 | 0.3 | WNW | 797.1 | 765 | 721.1 |
| June 27, 2020 | 564 | -4.3 C | -56.4 C | -89.3 C | 15.4 | 4.7 | 0.2 | WNW | 794.3 | 766.9 | 724.3 |
| June 26, 2020 | 563 | -3.9 C | -53.6 C | -89.5 C | 18.5 | 5 | 0.2 | WNW | 789.5 | 758.2 | 724.3 |
| June 25, 2020 | 562 | -13.3 C | -59.3 C | -89.5 C | 23 | 7 | 0.5 | WNW | 795.2 | 767.7 | 729.5 |
| June 24, 2020 | 561 | -2.9 C | -56.2 C | -89.7 C | 17.8 | 5.4 | 0.2 | WNW | 783.3 | 761.3 | 729 |
| June 23, 2020 | 560 | -11.5 C | -59.5 C | -91.4 C | 19.4 | 6.4 | 0.2 | WNW | 790.2 | 763.5 | 726.2 |
| June 22, 2020 | 559 | -2.8 C | -57.9 C | -90.7 C | 14.8 | 4.6 | 0.2 | WNW | 781.5 | 757.3 | 725.9 |
| June 21, 2020 | 558 | -4.9 C | -58.8 C | -91 C | 17.4 | 4.6 | 0.2 | WNW | 782.2 | 756.4 | 721.1 |
| June 20, 2020 | 557 | -1 C | -62 C | -92.1 C | 13.6 | 3.8 | 0.2 | WNW | 772.2 | 751.8 | 719.7 |
| June 19, 2020 | 556 | -6.5 C | -58.8 C | -90.8 C | 21.3 | 6.4 | 0.2 | WNW | 774.5 | 748 | 719.5 |
| June 18, 2020 | 555 | -3.5 C | -55.3 C | -91 C | 19.3 | 5.4 | 0.2 | WNW | 770.1 | 749.7 | 720.4 |
| June 17, 2020 | 554 | -4 C | -57 C | -92.4 C | 17.1 | 5.7 | 0.2 | WNW | 768.1 | 750.5 | 715.3 |
| June 16, 2020 | 553 | 0 C | -56.2 C | -91.2 C | 17.1 | 5.4 | 0.2 | WNW | 768.9 | 749.3 | 719.4 |
| June 15, 2020 | 552 | -1.9 C | -56.1 C | -91.2 C | 15.9 | 4.5 | 0.2 | WNW | 765.1 | 743.8 | 711.9 |
| June 14, 2020 | 551 | -1.3 C | -58 C | -92.3 C | 16.3 | 4.2 | 0.2 | WNW | 764.4 | 743.6 | 711 |
| June 13, 2020 | 550 | 0.9 C | -59.1 C | -92.1 C | 20.7 | 4.5 | 0.2 | WNW | 763.4 | 744.5 | 710.8 |
| June 12, 2020 | 549 | -1.5 C | -61.9 C | -91.9 C | 18.2 | 4.2 | 0.2 | SW | 760.7 | 738.7 | 708.9 |
| June 11, 2020 | 548 | -2.8 C | -57.6 C | -91.2 C | 20.1 | 4.9 | 0.2 | WNW | 763.2 | 741.1 | 711.5 |
| June 10, 2020 | 547 | -1 C | -58.2 C | -92.2 C | 14.2 | 4.2 | 0.2 | WNW | 759.6 | 739.6 | 712.5 |
| June 9, 2020 | 546 | -6.6 C | -64.9 C | -92.7 C | 25.1 | 6.4 | 0.2 | WNW | 758.6 | 741.1 | 709.5 |
| June 8, 2020 | 545 | -4.9 C | -58.3 C | -92.5 C | 20.3 | 5.8 | 0.2 | WNW | 754.8 | 738.7 | 715 |
| June 7, 2020 | 544 | -6.1 C | -66.9 C | -92 C | 22.9 | 6.2 | 0.4 | WNW | 752.9 | 736.5 | 708.9 |
| June 6, 2020 | 543 | -6.6 C | -53 C | -92.9 C | 21 | 7.2 | 0.3 | WNW | 750.5 | 735.9 | 710.6 |
| June 5, 2020 | 542 | 0 | -62.7 C | -92.2 C | 18.3 | 5 | 0.3 | WNW | 746.5 | 727 | 703.3 |
| June 4, 2020 | 541 | -1.6 C | -55.8 C | -91.8 C | 17.7 | 5.1 | 0.2 | WNW | 747.8 | 728.1 | 702.3 |
| June 3, 2020 | 540 | 1.6 C | -55.5 C | -92.2 C | 20.3 | 4.9 | 0.3 | WNW | 745.5 | 725.5 | 700.6 |
| June 2, 2020 | 539 | -4.5 C | -53.9 C | -92.5 C | 21.1 | 6.6 | 0.3 | WNW | 746.6 | 724.7 | 699.6 |
| June 1, 2020 | 538 | -3.5 C | -57 C | -92 C | 17.8 | 5.7 | 0.2 | WNW | 745.3 | 723.9 | 699.7 |
| Time | Air Temperature (°C) | Wind Speed (m/s) | Pressure (Pa) | ||||||||
|---|---|---|---|---|---|---|---|---|---|---|---|
| Date | Sol | Max | Avg | Min | Max | Avg | Min | Direction | Max | Avg | Min |
| May 30, 2020 | 537 | -0.8 C | -54.6 C | -92.7 C | 19.5 | 4.7 | 0.3 | WNW | 741.7 | 719.2 | 695.7 |
| May 29, 2020 | 536 | -7.3 C | -62.9 C | -91.5 C | 20 | 5.9 | 0.3 | SW | 743.6 | 724.2 | 695.1 |
| May 28, 2020 | 535 | -2.7 C | -54 C | -91.3 C | 16.7 | 5.1 | 0.3 | SW | 739.9 | 719.3 | 695.7 |
| May 27, 2020 | 534 | 0.9 C | -57.4 C | -92.8 C | 18.8 | 4.6 | 0.2 | WNW | 738.9 | 716.5 | 690.7 |
| May 26, 2020 | 533 | -6.7 C | -56.5 C | -92.8 C | 21.3 | 6 | 0.3 | WNW | 738.8 | 717.3 | 692.1 |
| May 25, 2020 | 532 | -1.1 C | -54.6 C | -93.1 C | 17.7 | 4.8 | 0.3 | SW | 735.2 | 714 | 691 |
| May 24, 2020 | 531 | -6.1 C | -57.3 C | -93.5 C | 21.7 | 5.8 | 0.3 | WNW | 735.1 | 713.6 | 688.4 |
| May 23, 2020 | 530 | 0.4 C | -64.7 C | -92.6 C | 17.4 | 4.7 | 0.3 | SW | 732.7 | 713.8 | 689 |
| May 22, 2020 | 529 | 0.6 C | -57 C | -93.2 C | 15.5 | 4.6 | 0.2 | WNW | 731 | 708.9 | 683.4 |
| May 21, 2020 | 528 | -5.3 C | -55 C | -93.5 C | 23.6 | 6.3 | 0.3 | WNW | 731.8 | 709.5 | 686.4 |
| May 20, 2020 | 527 | 0.8 C | -55.9 C | -93 C | 18.9 | 4.5 | 0.3 | WNW | 725.5 | 707.5 | 684.8 |
| May 19, 2020 | 526 | -1.8 C | -56.4 C | -94 C | 19.6 | 4.9 | 0.3 | WNW | 728.1 | 705.2 | 681.2 |
| May 18, 2020 | 525 | -0.4 C | -57.2 C | -93.6 C | 18.5 | 4.8 | 0.3 | WNW | 727.7 | 707.3 | 681.1 |
| May 17, 2020 | 524 | 0.5 C | -54.7 C | -92.5 C | 15.3 | 4.6 | 0.3 | SW | 724.9 | 701.6 | 677.7 |
| May 16, 2020 | 523 | -2.2 C | -57.4 C | -93.2 C | 18.2 | 4.8 | 0.2 | WNW | 724.2 | 703.2 | 676 |
| May 15, 2020 | 522 | -1.7 C | -56.6 C | -93.2 C | 18.8 | 4.9 | 0.2 | WNW | 722.5 | 699.9 | 675.8 |
| May 14, 2020 | 521 | -1.1 C | -64.8 C | -93.2 C | 18.3 | 4.5 | 0.2 | SW | 720.2 | 700.3 | 672.2 |
| May 13, 2020 | 520 | -1.4 C | -56.3 C | -92.9 C | 19.5 | 4.7 | 0.2 | SW | 720.4 | 695.9 | 672 |
| May 12, 2020 | 519 | -0.3 C | -62.7 C | -92.3 C | 15.8 | 4.5 | 0.2 | SW | 718 | 697.7 | 670.7 |
| May 11, 2020 | 518 | -0.9 C | -55.1 C | -93.3 C | 16 | 4.7 | 0.3 | SW | 717.5 | 692.2 | 667.3 |
| May 10, 2020 | 517 | 1.2 C | -56.4 C | -92.6 C | 17.5 | 4.4 | 0.2 | SW | 716.1 | 692.2 | 668.2 |
| May 9, 2020 | 516 | 1.4 C | -54.8 C | -93.2 C | 13.8 | 4.5 | 0.2 | SW | 714.2 | 689.7 | 665.4 |
| May 8, 2020 | 515 | -4.4 C | -58 C | -93.8 C | 19 | 4.5 | 0.2 | SW | 714.3 | 687.9 | 663.8 |
| May 7, 2020 | 514 | -2.8 C | -51.7 C | -92.3 C | 16.8 | 4.5 | 0.3 | WNW | 712.5 | 687.7 | 663.4 |
| May 6, 2020 | 513 | -0.1 C | -56.1 C | -93 C | 16.2 | 4.6 | 0.2 | SW | 711.1 | 683.7 | 660.2 |
| May 5, 2020 | 512 | -3.1 C | -56.4 C | -92.9 C | 19.2 | 4.7 | 0.3 | SW | 709.1 | 683.9 | 659.2 |
| May 4, 2020 | 511 | -3.6 C | -57.8 C | -93.2 C | 16.8 | 4.7 | 0.3 | WNW | 707.8 | 682.9 | 658.1 |
| May 3, 2020 | 510 | -1.5 C | -57.6 C | -93 C | 16 | 4.5 | 0.2 | WNW | 706.5 | 681.5 | 656.5 |
| May 2, 2020 | 509 | -2.2 C | -57.7 C | -93.2 C | 17.9 | 4.8 | 0.2 | SW | 709.3 | 681.1 | 656 |
| May 1, 2020 | 508 | -2.4 C | -57.9 C | -92.2 C | 15.8 | 4.5 | 0.2 | WNW | 708.5 | 680 | 654.7 |
| Time | Air Temperature (°C) | Wind Speed (m/s) | Pressure (Pa) | ||||||||
|---|---|---|---|---|---|---|---|---|---|---|---|
| Date | Sol | Max | Avg | Min | Max | Avg | Min | Direction | Max | Avg | Min |
| Apr. 30, 2020 | 507 | -2.4 C | -55.3 C | -92.1 C | 18.2 | 4.8 | 0.2 | SW | 707.2 | 677.8 | 653.2 |
| Apr. 29, 2020 | 506 | -3.7 C | -58.1 C | -93.5 C | 15.6 | 4.5 | 0.2 | WNW | 705.1 | 677.2 | 651.7 |
| Apr. 28, 2020 | 505 | -6.6 C | -65.1 C | -93.8 C | 13.2 | 4.2 | 0.4 | WNW | 689.2 | 669.9 | 652 |
| Apr. 27, 2020 | 504 | -6.7 C | -64.1 C | -93.6 C | 15 | 4.6 | 0.3 | SW | 700.5 | 675.9 | 650.9 |
| Apr. 26, 2020 | 503 | -4.9 C | -57.2 C | -93.8 C | 17.5 | 4.6 | 0.2 | WNW | 700 | 673.4 | 650.2 |
| Apr. 25, 2020 | 502 | -4.9 C | -58.3 C | -94 C | 14.8 | 4.5 | 0.2 | SW | 699.6 | 673.2 | 650.1 |
| Apr. 23, 2020 | 501 | -4.3 C | -61.2 C | -93.5 C | 18.8 | 4.5 | 0.2 | SW | 697.5 | 669.1 | 647.3 |
| Apr. 22, 2020 | 500 | -3.5 C | -58.9 C | -93.8 C | 19.4 | 4.4 | 0.2 | WNW | 697.2 | 669.3 | 645.8 |
| Apr. 21, 2020 | 499 | -3.6 C | -60.4 C | -94.4 C | 17 | 4.5 | 0.3 | SW | 693.3 | 668.5 | 645.4 |
| Apr. 20, 2020 | 498 | -5.6 C | -58.9 C | -94.3 C | 17 | 4.6 | 0.3 | SW | 694.2 | 665.9 | 645.9 |
| Apr. 19, 2020 | 497 | -4.1 C | -59.2 C | -94.3 C | 16.6 | 4.4 | 0.2 | SW | 690.2 | 666.6 | 644.1 |
| Apr. 18, 2020 | 496 | -6.2 C | -61.7 C | -94.6 C | 15.7 | 4.6 | 0.3 | SW | 688.4 | 664.8 | 641.4 |
| Apr. 17, 2020 | 495 | -4.2 C | -59.1 C | -94 C | 16.7 | 4.6 | 0.2 | WNW | 689 | 663.2 | 640.2 |
| Apr. 16, 2020 | 494 | -3.7 C | -59.4 C | -95.4 C | 16.5 | 4.6 | 0.3 | WNW | 687.9 | 662.6 | 639.3 |
| Apr. 15, 2020 | 493 | -5.3 C | -59.6 C | -94.8 C | 17.1 | 4.8 | 0.2 | WNW | 688.6 | 661.3 | 637.3 |
| Apr. 14, 2020 | 492 | -5.5 C | -59.4 C | -94.4 C | 14.9 | 4.8 | 0.2 | WNW | 689.8 | 658.5 | 636.4 |
| Apr. 13, 2020 | 491 | -3.6 C | -59.1 C | -93.2 C | 16.9 | 4.8 | 0.2 | WNW | 688.7 | 660.3 | 635.2 |
| Apr. 12, 2020 | 490 | -4.9 C | -60.6 C | -94.3 C | 15.3 | 4.8 | 0.3 | WNW | 687.5 | 659.3 | 634 |
| Apr. 11, 2020 | 489 | -6.5 C | -54.6 C | -93.5 C | 17.4 | 4.8 | 0.3 | WNW | 685.4 | 658.6 | 634.1 |
| Apr. 10, 2020 | 488 | -19.7 C | -70.8 C | -93.8 C | 13 | 4.6 | 0.3 | WNW | 685.2 | 662.8 | 634.6 |
| Apr. 9, 2020 | 487 | -6.6 C | -58.3 C | -93.5 C | 15.7 | 4.9 | 0.3 | WNW | 681.1 | 655.4 | 632.3 |
| Apr. 8, 2020 | 486 | -5.3 C | -65.3 C | -94.7 C | 17 | 5 | 0.2 | SW | 680.8 | 657.3 | 630.7 |
| Apr. 7, 2020 | 485 | -7 C | -59.4 C | -93.4 C | 21.4 | 5.1 | 0.3 | WNW | 678.6 | 654.5 | 630 |
| Apr. 6, 2020 | 484 | -7 C | -58.4 C | -94.3 C | 18.3 | 5.1 | 0.2 | WNW | 679.3 | 652.9 | 627.9 |
| Apr. 5, 2020 | 483 | -8.4 C | -59.8 C | -94.8 C | 20 | 5.4 | 0.2 | WNW | 679.1 | 652.3 | 626 |
| Apr. 4, 2020 | 482 | -6.1 C | -62.3 C | -93.1 C | 17.2 | 4.4 | 0.2 | WNW | 679.2 | 653.1 | 625.4 |
| Apr. 3, 2020 | 481 | -5.9 C | -59.8 C | -93.9 C | 18.3 | 5.3 | 0.3 | WNW | 679 | 650.4 | 624.2 |
| Apr. 2, 2020 | 480 | -6.7 C | -65.4 C | -93 C | 17.2 | 5.5 | 0.3 | WNW | 678.1 | 651.6 | 623.5 |
| Apr. 1, 2020 | 479 | -8 C | -66 C | -93.8 C | 19.6 | 5.6 | 0.2 | SW | 676.7 | 651.1 | 622.6 |
| Time | Air Temperature (°C) | Wind Speed (m/s) | Pressure (Pa) | ||||||||
|---|---|---|---|---|---|---|---|---|---|---|---|
| Date | Sol | Max | Avg | Min | Max | Avg | Min | Direction | Max | Avg | Min |
| Mar. 31, 2020 | 478 | -8.5 C | -59.6 C | -93.3 C | 18.2 | 5.7 | 0.2 | WNW | 676.8 | 647.2 | 622.4 |
| Mar. 30, 2020 | 477 | -6.5 C | -59.4 C | -93 C | 19.3 | 5.7 | 0.3 | WNW | 675.2 | 646.7 | 621.6 |
| Mar. 29, 2020 | 476 | -7.2 C | -57.2 C | -92.7 C | 18.8 | 5.9 | 0.3 | WNW | 673.1 | 646.3 | 620 |
| Mar. 28, 2020 | 475 | -7.7 C | -77.3 C | -94.6 C | 19.5 | 5.5 | 0.3 | SSW | 674.3 | 648 | 619.3 |
| Mar. 27, 2020 | 474 | -7.3 C | -65.7 C | -94 C | 20 | 5.4 | 0.2 | WNW | 672.8 | 644.3 | 618.3 |
| Mar. 26, 2020 | 473 | -8.4 C | -60.8 C | -94.1 C | 21.5 | 5.6 | 0.2 | WNW | 671.7 | 642.7 | 616.3 |
| Mar. 25, 2020 | 472 | -7.8 C | -52.9 C | -94.2 C | 20.2 | 5.9 | 0.2 | WNW | 669.9 | 640 | 616 |
| Mar. 24, 2020 | 471 | -7.1 C | -58.4 C | -94.9 C | 21.1 | 5.6 | 0.2 | WNW | 670 | 640.8 | 614.6 |
| Mar. 23, 2020 | 470 | -7.7 C | -66.6 C | -95.6 C | 20.6 | 5.7 | 0.2 | WNW | 668 | 640.1 | 613.8 |
| Mar. 9, 2020 | 457 | -9.1 C | -59.1 C | -95.7 C | 21 | 6 | 0.2 | SSE | 661.1 | 633.5 | 604.9 |
| Mar. 8, 2020 | 456 | -9.6 C | -61.5 C | -94.6 C | 20.2 | 5.8 | 0.2 | SSE | 661.1 | 633.9 | 604.4 |
| Mar. 7, 2020 | 455 | -12.8 C | -64 C | -95.4 C | 20.7 | 5.3 | 0.3 | WNW | 661.6 | 632.3 | 605.5 |
| Mar. 6, 2020 | 454 | -12.5 C | -61.7 C | -95.9 C | 25.2 | 5.7 | 0.2 | SSE | 660.3 | 633.9 | 606.5 |
| Mar. 5, 2020 | 453 | -10.8 C | -59.8 C | -95.1 C | 21.4 | 6 | 0.3 | SSW | 657.5 | 631.9 | 605.3 |
| Mar. 4, 2020 | 452 | -9.2 C | -58.7 C | -94.2 C | 19.6 | 5.9 | 0.2 | SSW | 655.3 | 630.6 | 605.4 |
| Mar. 3, 2020 | 451 | -10.3 C | -62.2 C | -93.6 C | 21.5 | 6.1 | 0.2 | SSE | 656.4 | 631.3 | 604.8 |
| Mar. 2, 2020 | 450 | -10.4 C | -63.4 C | -93.5 C | 23 | 5.4 | 0.2 | SSW | 655.2 | 630.2 | 603.8 |
| Mar. 1, 2020 | 449 | -11.3 C | -57.2 C | -93.6 C | 23.9 | 6.2 | 0.3 | SSW | 654 | 628.7 | 603.6 |
| Time | Air Temperature (°C) | Wind Speed (m/s) | Pressure (Pa) | ||||||||
|---|---|---|---|---|---|---|---|---|---|---|---|
| Date | Sol | Max | Avg | Min | Max | Avg | Min | Direction | Max | Avg | Min |
| Feb. 29, 2020 | 448 | -8.3 C | -64 C | -94.1 C | 23.3 | 5.6 | 0.2 | SSW | 652.6 | 628.4 | 603.7 |
| Feb. 28, 2020 | 447 | -11.1 C | -59.7 C | -92.6 C | 20.2 | 5.9 | 0.3 | WNW | 653.6 | 630.3 | 603.1 |
| Feb. 27, 2020 | 446 | -10.9 C | -57.4 C | -93.6 C | 20.6 | 5.7 | 0.2 | WNW | 654.7 | 629.5 | 603.2 |
| Feb. 26, 2020 | 445 | -12.8 C | -65 C | -92.8 C | 21.1 | 5.4 | 0.3 | W | 653.8 | 630.5 | 601.8 |
| Feb. 25, 2020 | 444 | -12 C | -67.2 C | -93.8 C | 21.2 | 5.8 | 0.2 | SSW | 651.4 | 631.2 | 600.2 |
| Feb. 24, 2020 | 443 | -12.3 C | -61.3 C | -94.8 C | 22.2 | 5.9 | 0.2 | WNW | 650.9 | 629.2 | 600.2 |
| Feb. 23, 2020 | 442 | -10.5 C | -67.2 C | -94.1 C | 21.1 | 5.4 | 0.2 | WNW | 654.9 | 629.9 | 602 |
| Feb. 22, 2020 | 441 | -13.5 C | -62.1 C | -95.1 C | 21 | 5.5 | 0.2 | W | 655.6 | 629 | 601.1 |
| Feb. 21, 2020 | 440 | -13 C | -64.1 C | -95.2 C | 23.7 | 6 | 0.2 | W | 654 | 627.2 | 601.5 |
| Feb. 20, 2020 | 439 | -9.3 C | -59.3 C | -94.6 C | 23.2 | 5.8 | 0.2 | W | 650.9 | 627.8 | 601.2 |
| Feb. 19, 2020 | 438 | -10 C | -61.3 C | -95.4 C | 22.5 | 5.5 | 0.3 | WNW | 650.9 | 628.7 | 603.2 |
| Feb. 18, 2020 | 437 | -9.9 C | -61.8 C | -94.7 C | 21.6 | 5.9 | 0.3 | W | 652.2 | 630 | 603.4 |
| Feb. 17, 2020 | 436 | -10.3 C | -63.2 C | -94.4 C | 21.5 | 5.6 | 0.3 | W | 652.9 | 628.7 | 602 |
| Feb. 16, 2020 | 435 | -10.2 C | -59.5 C | -93.8 C | 23 | 7.3 | 0.2 | SSE | 652.7 | 629.6 | 600.5 |
| Feb. 15, 2020 | 434 | -7.3 C | -57.4 C | -94.5 C | 22 | 5.6 | 0.2 | W | 652.1 | 627.8 | 602.1 |
| Feb. 14, 2020 | 433 | -8.9 C | -61.1 C | -94.2 C | 21.6 | 6.1 | 0.2 | W | 653.6 | 631.1 | 601.9 |
| Feb. 13, 2020 | 432 | -9.4 C | -61.3 C | -94.2 C | 21.1 | 5.9 | 0.2 | W | 652.9 | 631.6 | 601 |
| Feb. 12, 2020 | 431 | -11.9 C | -60.4 C | -93.9 C | 21.6 | 5 | 0.3 | W | 652.1 | 626.9 | 601 |
| Feb. 11, 2020 | 430 | -13 C | -61.2 C | -93.3 C | 21.6 | 5.9 | 0.2 | W | 651.2 | 628.8 | 600.5 |
| Feb. 10, 2020 | 429 | -10.4 C | -59.4 C | -94.8 C | 26.3 | 6.2 | 0.2 | W | 651.1 | 625.4 | 600.6 |
| Feb. 8, 2020 | 428 | -8.7 C | -62.1 C | -91.6 C | 25.4 | 5.9 | 0.3 | WNW | 648 | 628.8 | 602.2 |
| Feb. 7, 2020 | 427 | -9.8 C | -60.6 C | -91.7 C | 25 | 6 | 0.3 | WNW | 647.4 | 627.7 | 600.7 |
| Feb. 6, 2020 | 426 | -9.1 C | -66.2 C | -91.6 C | 22.6 | 5.5 | 0.2 | WNW | 648.4 | 630 | 601.2 |
| Feb. 5, 2020 | 425 | -11.1 C | -59.6 C | -90.6 C | 21.3 | 5.5 | 0.2 | SSE | 649.8 | 627.7 | 602.2 |
| Feb. 4, 2020 | 424 | -12.6 C | -57.5 C | -91.9 C | 22.9 | 5.7 | 0.2 | SSE | 647.4 | 627.4 | 602.4 |
| Feb. 3, 2020 | 423 | -9.7 C | -64.2 C | -92.2 C | 20.5 | 4.5 | 0.2 | W | 645.4 | 627.1 | 602.3 |
| Feb. 2, 2020 | 422 | -13.1 C | -50.9 C | -90.2 C | 22.1 | 6.1 | 0.2 | SSE | 646.4 | 624.4 | 602.2 |
| Feb. 1, 2020 | 421 | -13.8 C | -56.5 C | -93.1 C | 21 | 5.4 | 0.3 | SSE | 646.1 | 626.8 | 602.7 |
| Time | Air Temperature (°C) | Wind Speed (m/s) | Pressure (Pa) | ||||||||
|---|---|---|---|---|---|---|---|---|---|---|---|
| Date | Sol | Max | Avg | Min | Max | Avg | Min | Direction | Max | Avg | Min |
| Jan. 31, 2020 | 420 | -13.7 C | -66.7 C | -93.7 C | 18.5 | 4.8 | 0.2 | W | 645.9 | 630.6 | 603.4 |
| Jan. 30, 2020 | 419 | -12.5 C | -61.2 C | -96.1 C | 20.2 | 5.1 | 0.2 | W | 642.7 | 628.6 | 605.5 |
| Jan. 29, 2020 | 418 | -15.6 C | -57.9 C | -94.1 C | 22 | 5.9 | 0.2 | SSW | 640.6 | 628 | 604.5 |
| Jan. 28, 2020 | 417 | -15.3 C | -61.2 C | -94 C | 23.6 | 6 | 0.3 | W | 642 | 631.5 | 606.4 |
| Jan. 27, 2020 | 416 | -14.5 C | -67.6 C | -93.9 C | 23.3 | 5.5 | 0.2 | S | 644.7 | 629.5 | 607.3 |
| Jan. 26, 2020 | 415 | -14.3 C | -64 C | -95.1 C | 23.2 | 5.9 | 0.2 | W | 646.2 | 631.5 | 609.4 |
| Jan. 25, 2020 | 414 | -15.9 C | -62.6 C | -95.7 C | 21.3 | 4.8 | 0.3 | W | 644.6 | 630.5 | 609.3 |
| Jan. 24, 2020 | 413 | -16 C | -62.2 C | -96.5 C | 19.8 | 5.5 | 0.2 | SSE | 644.5 | 632 | 609.6 |
| Jan. 23, 2020 | 412 | -14.5 C | -63.9 C | -96.9 C | 19.7 | 5.5 | 0.2 | S | 645.6 | 633 | 610.9 |
| Jan. 22, 2020 | 411 | -16.7 C | -63.4 C | -96.4 C | 22.7 | 5.2 | 0.2 | S | 646 | 633.2 | 613.4 |
| Jan. 21, 2020 | 410 | -12.5 C | -68.2 C | -97.5 C | 19.7 | 5 | 0.2 | S | 642.5 | 634.1 | 613 |
| Jan. 20, 2020 | 409 | -15.4 C | -62.9 C | -98.6 C | 21 | 5.1 | 0.2 | S | 644.2 | 632.5 | 613.7 |
| Jan. 19, 2020 | 408 | -16 C | -63.9 C | -97.1 C | 20.7 | 5.4 | 0.2 | SSE | 645.1 | 634 | 615.1 |
| Jan. 18, 2020 | 407 | -16.5 C | -64.5 C | -99.5 C | 22.2 | 4.9 | 0.2 | WNW | 646.5 | 634 | 616.1 |
| Jan. 17, 2020 | 406 | -17.1 C | -63.3 C | -100 C | 20.7 | 5.2 | 0.2 | SSE | 648.4 | 634.4 | 616 |
| Jan. 16, 2020 | 405 | -16.8 C | -64.1 C | -102.5 C | 23.1 | 5.5 | 0.2 | SSE | 651 | 635.8 | 616.8 |
| Jan. 15, 2020 | 404 | -16.8 C | -66 C | -99.5 C | 19.8 | 5.1 | 0.2 | SW | 652.4 | 636.1 | 617.7 |
| Jan. 14, 2020 | 403 | -16.9 C | -62.4 C | -101.3 C | 21 | 5.7 | 0.2 | SSE | 653.5 | 636.9 | 618.2 |
| Jan. 13, 2020 | 402 | -16.8 C | -65.5 C | -100 C | 21.1 | 5.4 | 0.2 | SSE | 653.7 | 637.8 | 618 |
| Jan. 12, 2020 | 401 | -17 C | -64.8 C | -100.2 C | - | - | - | n/a | 653.3 | 638.3 | 620.8 |
| Jan. 11, 2020 | 400 | -15.7 C | -66.6 C | -99.1 C | 23 | 6.3 | 0.2 | SE | 653.3 | 640.1 | 620.6 |
| Jan. 10, 2020 | 399 | -17.5 C | -61.6 C | -97.8 C | 22.5 | 6.4 | 0.2 | SE | 652.7 | 638.2 | 620.8 |
| Jan. 9, 2020 | 398 | -16.8 C | -68.7 C | -100.6 C | 24.4 | 6.7 | 0.2 | SE | 652.6 | 640.8 | 621.7 |
| Jan. 8, 2020 | 397 | -15.7 C | -67.3 C | -100.1 C | 27 | 6.5 | 0.2 | SE | 654.1 | 640.3 | 622.6 |
| Jan. 7, 2020 | 396 | -18.2 C | -70.8 C | -100.1 C | 21.9 | 6 | 0.2 | SW | 656.2 | 641.8 | 624.5 |
| Jan. 6, 2020 | 395 | -17.8 C | -62.3 C | -99.6 C | 20.3 | 6.2 | 0.2 | SE | 654.8 | 641.1 | 624.8 |
| Jan. 5, 2020 | 394 | -17.7 C | -63.3 C | -99 C | 23.3 | 6.6 | 0.2 | SE | 656.8 | 643.4 | 625 |
| Jan. 4, 2020 | 393 | -17.6 C | -68.8 C | -97.7 C | 21.6 | 5.5 | 0.2 | SSW | 656.3 | 643.2 | 625 |
| Jan. 2, 2020 | 392 | -17.7 C | -66 C | -98.2 C | 20.6 | 6.1 | 0.2 | SSE | 657.2 | 644.2 | 625.7 |
| Jan. 1, 2020 | 391 | -17.6 C | -60.6 C | -99 C | 21.9 | 5.7 | 0.2 | SE | 657.2 | 642.9 | 627.5 |
| Time | Air Temperature (°C) | Wind Speed (m/s) | Pressure (Pa) | ||||||||
|---|---|---|---|---|---|---|---|---|---|---|---|
| Date | Sol | Max | Avg | Min | Max | Avg | Min | Direction | Max | Avg | Min |
| Dec. 31, 2019 | 390 | -17.8 C | -65.8 C | -100.2 C | 27.8 | 5.8 | 0.2 | SSE | 657.9 | 644.3 | 628 |
| Dec. 30, 2019 | 389 | -18.6 C | -60.4 C | -99.2 C | 23.1 | 5.9 | 0.2 | SSE | 658.3 | 642.6 | 628.6 |
| Dec. 29, 2019 | 388 | -17.3 C | -65.9 C | -98.9 C | 22.7 | 5.7 | 0.2 | SSE | 659.3 | 643.3 | 630.3 |
| Dec. 28, 2019 | 387 | -18.4 C | -65.8 C | -98.6 C | 21 | 5.7 | 0.2 | SSE | 659.3 | 647.6 | 630 |
| Dec. 27, 2019 | 386 | -18 C | -62 C | -97.3 C | - | - | - | n/a | 659.7 | 644.9 | 630.5 |
| Dec. 26, 2019 | 385 | -18.6 C | -60 C | -96.4 C | 21.2 | 6.4 | 0.2 | SSE | 661.6 | 646.4 | 631.2 |
| Dec. 25, 2019 | 384 | -22.4 C | -72.2 C | -96.5 C | 21.5 | 4.9 | 0.2 | SSE | 662 | 649.8 | 631.2 |
| Dec. 24, 2019 | 383 | -18.5 C | -67.5 C | -98.1 C | 24.3 | 5.6 | 0.2 | SSE | 662.3 | 647.5 | 632.9 |
| Dec. 23, 2019 | 382 | -16.4 C | -62.3 C | -96.9 C | 20.2 | 6 | 0.2 | SSE | 663.8 | 649 | 634.4 |
| Dec. 22, 2019 | 381 | -19.5 C | -61.9 C | -98 C | 21.7 | 5.7 | 0.2 | SSE | 663.4 | 648 | 634.9 |
| Dec. 21, 2019 | 380 | -20.6 C | -62.6 C | -97.9 C | 21.5 | 6.3 | 0.2 | SSE | 664.5 | 649.8 | 633.7 |
| Dec. 20, 2019 | 379 | -20 C | -67.8 C | -96.3 C | 20.7 | 5.3 | 0.2 | SSE | 663.3 | 651.2 | 635.4 |
| Dec. 19, 2019 | 378 | -20 C | -65.8 C | -97.7 C | 23.8 | 5.7 | 0.2 | SSE | 665.3 | 653.4 | 636.2 |
| Dec. 18, 2019 | 377 | -19.9 C | -59.3 C | -97.5 C | 21 | 6.4 | 0.2 | SSE | 665.5 | 649.8 | 636.3 |
| Dec. 17, 2019 | 376 | -19.3 C | -65.6 C | -98.2 C | 20.8 | 5.7 | 0.2 | SSE | 665.8 | 652.3 | 637.5 |
| Dec. 16, 2019 | 375 | -19.8 C | -69.9 C | -97.5 C | 22.1 | 5.6 | 0.2 | SW | 667.5 | 654.7 | 638.4 |
| Dec. 15, 2019 | 374 | -21.2 C | -65.4 C | -97.3 C | 22 | 5.6 | 0.2 | SSE | 668.4 | 654.1 | 639.4 |
| Dec. 14, 2019 | 373 | -20.1 C | -71.6 C | -98.1 C | 19.7 | 5 | 0.2 | SW | 668.7 | 656.8 | 640.2 |
| Dec. 13, 2019 | 372 | -21.2 C | -66.3 C | -97.2 C | 20.2 | 6 | 0.2 | SSE | 670.2 | 656.8 | 640.3 |
| Dec. 12, 2019 | 371 | -19.8 C | -65.2 C | -96.6 C | 21 | 5.6 | 0.2 | SE | 671.8 | 657.7 | 641.8 |
| Dec. 11, 2019 | 370 | -19.5 C | -69.7 C | -99 C | 19.6 | 5.1 | 0.2 | SSE | 672.1 | 658.2 | 642.8 |
| Dec. 10, 2019 | 369 | -21.2 C | -67.6 C | -98.2 C | 19.7 | 5.3 | 0.2 | SSE | 673 | 659.6 | 644.8 |
| Dec. 9, 2019 | 368 | -20.9 C | -66.2 C | -100 C | 20.9 | 4.9 | 0.2 | SSE | 673.8 | 660.4 | 646 |
| Dec. 8, 2019 | 367 | -20.9 C | -71.1 C | -139.9 C | 21.9 | 5.2 | 0.2 | SSE | 672.8 | 661 | 646.1 |
| Dec. 7, 2019 | 366 | -20.4 C | -61.5 C | -98.9 C | 20.4 | 5.6 | 0.2 | SSE | 674.7 | 660.9 | 646.4 |
| Dec. 6, 2019 | 365 | -21.5 C | -66.9 C | -98.8 C | 20.2 | 5.1 | 0.2 | SSW | 676.5 | 662.5 | 647.2 |
| Dec. 5, 2019 | 364 | -20.3 C | -66.6 C | -99.9 C | 21.7 | 5.3 | 0.2 | SSE | 678.1 | 663.5 | 646.6 |
| Dec. 4, 2019 | 363 | -21.1 C | -66.4 C | -99.8 C | 20.3 | 5.3 | 0.2 | SSE | 678.8 | 664.5 | 649.5 |
| Dec. 3, 2019 | 362 | -21.2 C | -64.2 C | -98.5 C | 20 | 5.1 | 0.2 | SSE | 679.4 | 665.2 | 650.2 |
| Dec. 2, 2019 | 361 | -21.2 C | -66.7 C | -98.2 C | 18.9 | 5.3 | 0.2 | SSE | 682 | 666.3 | 651.1 |
| Dec. 1, 2019 | 360 | -20.6 C | -68.3 C | -100.1 C | 19.9 | 4.9 | 0.2 | SSE | 682.3 | 667.5 | 651.7 |
| Time | Air Temperature (°C) | Wind Speed (m/s) | Pressure (Pa) | ||||||||
|---|---|---|---|---|---|---|---|---|---|---|---|
| Date | Sol | Max | Avg | Min | Max | Avg | Min | Direction | Max | Avg | Min |
| Nov. 30, 2019 | 359 | -21.8 C | -61.2 C | -99.3 C | 23.3 | 5.5 | 0.2 | SSE | 682 | 666.9 | 652.8 |
| Nov. 29, 2019 | 358 | -21.5 C | -68.4 C | -100.1 C | 19.5 | 5 | 0.2 | SSE | 683.9 | 669.2 | 653.6 |
| Nov. 28, 2019 | 357 | -20.8 C | -65.2 C | -101 C | 20.7 | 5.4 | 0.2 | SSE | 684.8 | 669.3 | 654.7 |
| Nov. 27, 2019 | 356 | -21.7 C | -63.5 C | -100 C | 19 | 5.2 | 0.2 | SSE | 685.3 | 669 | 655.3 |
| Nov. 25, 2019 | 355 | -23.2 C | -65.4 C | -99.6 C | 19.8 | 5.4 | 0.2 | SSE | 686.5 | 671.8 | 655.3 |
| Nov. 24, 2019 | 354 | -22.6 C | -73 C | -99.7 C | 23.9 | 4.9 | 0.2 | S | 688.4 | 675.2 | 657 |
| Nov. 23, 2019 | 353 | -23.3 C | -62.1 C | -100.6 C | 22 | 6.2 | 0.2 | SE | 687.6 | 672.2 | 657.3 |
| Nov. 22, 2019 | 352 | -22 C | -68.2 C | -100.7 C | 23.7 | 5.6 | 0.2 | SE | 688 | 674.1 | 657.7 |
| Nov. 21, 2019 | 351 | -22.6 C | -66 C | -100.4 C | 23.7 | 5.7 | 0.2 | SW | 689.9 | 674.9 | 659.5 |
| Nov. 20, 2019 | 350 | -23.2 C | -71.4 C | -103 C | 20.7 | 5 | 0.1 | SSE | 691.4 | 678.8 | 660.9 |
| Nov. 19, 2019 | 349 | -22.3 C | -68.4 C | -103.2 C | 18.4 | 4.8 | 0.2 | SSE | 692.7 | 678.1 | 662.4 |
| Nov. 18, 2019 | 348 | -23.2 C | -74.2 C | -102.5 C | 18.9 | 4.7 | 0.2 | SW | 694.6 | 680.8 | 661.9 |
| Nov. 17, 2019 | 347 | -23.7 C | -72.5 C | -102 C | 19.6 | 4.5 | 0.2 | SSE | 695.1 | 681.4 | 663.9 |
| Nov. 16, 2019 | 346 | -23.5 C | -71 C | -101.5 C | 20 | 4.8 | 0.2 | SSE | 694.8 | 682.6 | 661.3 |
| Nov. 15, 2019 | 345 | -23.9 C | -68.1 C | -100.4 C | 20.2 | 4.8 | 0.1 | SSE | 696.7 | 680.4 | 664.2 |
| Nov. 14, 2019 | 344 | -23.3 C | -67.1 C | -99.9 C | 18.9 | 5.3 | 0.2 | SSE | 697.1 | 681.4 | 664.6 |
| Nov. 13, 2019 | 343 | -23.1 C | -71.1 C | -100.8 C | 20.8 | 5.2 | 0.1 | SSE | 698.6 | 685.4 | 665.8 |
| Nov. 12, 2019 | 342 | -23.3 C | -73.1 C | -99.9 C | 20.5 | 4.7 | 0.2 | SW | 700.3 | 686.4 | 667.6 |
| Nov. 11, 2019 | 341 | -23.1 C | -66.9 C | -100.2 C | 21.7 | 5.6 | 0.2 | SSE | 701 | 684 | 667.8 |
| Nov. 10, 2019 | 340 | -24.4 C | -70.8 C | -101 C | 20.4 | 5.3 | 0.2 | SSE | 702.5 | 687.9 | 669.1 |
| Nov. 9, 2019 | 339 | -23.4 C | -64 C | -99.9 C | 20.8 | 5.1 | 0.2 | SSE | 701.9 | 689 | 670.6 |
| Nov. 8, 2019 | 338 | -24 C | -68.6 C | -102.5 C | 19.6 | 5.1 | 0.2 | SSE | 703.5 | 688.3 | 670.4 |
| Nov. 7, 2019 | 337 | -24 C | -68.8 C | -101.8 C | 21.2 | 4.9 | 0.2 | SSE | 705.3 | 689.3 | 671.8 |
| Nov. 6, 2019 | 336 | -24 C | -68.2 C | -101.4 C | 18.7 | 4.7 | 0.2 | SSE | 706.9 | 691.1 | 674.3 |
| Nov. 5, 2019 | 335 | -24.3 C | -68.6 C | -100.6 C | 19.9 | 5 | 0.2 | SSE | 709.1 | 691.8 | 674 |
| Nov. 4, 2019 | 334 | -23.8 C | -73.4 C | -100 C | 19.9 | 4.5 | 0.2 | SSW | 710.3 | 695.4 | 674.5 |
| Nov. 3, 2019 | 333 | -25.8 C | -69.4 C | -100.8 C | 18 | 4.7 | 0.2 | SSW | 710.7 | 694.1 | 676.9 |
| Nov. 2, 2019 | 332 | -25.2 C | -70.5 C | -99.8 C | 18.7 | 4.1 | 0.2 | SSW | 709.7 | 694.5 | 676.4 |
| Nov. 1, 2019 | 331 | -24.6 C | -66.9 C | -100.9 C | 18.5 | 5 | 0.2 | SSE | 711.4 | 693.8 | 676.9 |
| Time | Air Temperature (°C) | Wind Speed (m/s) | Pressure (Pa) | ||||||||
|---|---|---|---|---|---|---|---|---|---|---|---|
| Date | Sol | Max | Avg | Min | Max | Avg | Min | Direction | Max | Avg | Min |
| Oct. 31, 2019 | 330 | -24.8 C | -67.3 C | -101.8 C | 20.8 | 4.9 | 0.2 | SSE | 712.1 | 695.6 | 677.2 |
| Oct. 30, 2019 | 329 | -25 C | -72.7 C | -101.5 C | 19.2 | 4.6 | 0.2 | SW | 714.8 | 698.9 | 679.3 |
| Oct. 29, 2019 | 328 | -25.2 C | -70.3 C | -102.3 C | 18.3 | 4.9 | 0.2 | SSE | 715.2 | 696.6 | 679.7 |
| Oct. 28, 2019 | 327 | -25.3 C | -69.3 C | -102.6 C | 19.6 | 4.9 | 0.2 | SSE | 716 | 699.7 | 681.4 |
| Oct. 27, 2019 | 326 | -23.7 C | -63.2 C | -101.4 C | 18.2 | 5.2 | 0.2 | SSE | 717.8 | 698.3 | 683.9 |
| Oct. 26, 2019 | 325 | -24 C | -68 C | -102 C | 19.1 | 5 | 0.2 | SSE | 717.2 | 702.9 | 684 |
| Oct. 25, 2019 | 324 | -24.8 C | -69.1 C | -102.4 C | 23 | 5.4 | 0.2 | SE | 718.3 | 702.6 | 684.9 |
| Oct. 24, 2019 | 323 | -25.5 C | -69 C | -102.9 C | 19.1 | 4.6 | 0.1 | SE | 719.6 | 703.8 | 686.4 |
| Oct. 23, 2019 | 322 | -25.9 C | -69.7 C | -102.1 C | 20.6 | 5.5 | 0.2 | SE | 721.7 | 705.6 | 687.6 |
| Oct. 22, 2019 | 321 | -24.6 C | -71.6 C | -102.9 C | 18.6 | 4.4 | 0.1 | SSE | 722.3 | 705.9 | 687.9 |
| Oct. 21, 2019 | 320 | -25.6 C | -70 C | -102.4 C | 18.5 | 4.7 | 0.1 | SSE | 725.2 | 705.2 | 689.2 |
| Oct. 19, 2019 | 319 | -25.5 C | -70.1 C | -101.5 C | 18.4 | 4.7 | 0.1 | SSE | 724.4 | 709.1 | 691.6 |
| Oct. 18, 2019 | 318 | -24.6 C | -77.3 C | -102.6 C | 18.2 | 5.1 | 0.2 | SSE | 724.7 | 711.4 | 690.4 |
| Oct. 17, 2019 | 317 | -26.2 C | -66.5 C | -103.2 C | 22.2 | 5.6 | 0.1 | SSE | 726.7 | 708.6 | 691.5 |
| Oct. 16, 2019 | 316 | -25.7 C | -69.5 C | -101.8 C | 18.2 | 4.7 | 0.2 | SSE | 727.8 | 711.2 | 692.9 |
| Oct. 15, 2019 | 315 | -24.3 C | -70.4 C | -101.6 C | 20.4 | 4.9 | 0.2 | SSE | 728.6 | 712.5 | 694.6 |
| Oct. 14, 2019 | 314 | -24.8 C | -70.2 C | -102.8 C | 19.7 | 5.1 | 0.2 | SSE | 731.7 | 713 | 695.7 |
| Oct. 13, 2019 | 313 | -27.2 C | -68.7 C | -101.4 C | 22.5 | 4.9 | 0.2 | SSE | 732.6 | 715.4 | 696.6 |
| Oct. 12, 2019 | 312 | -26 C | -69 C | -100.4 C | 19.5 | 5.1 | 0.2 | SSW | 732.1 | 715.6 | 697.9 |
| Oct. 11, 2019 | 311 | -26.4 C | -75 C | -101.1 C | 19.1 | 4.4 | 0.2 | SSW | 732.3 | 718.2 | 697.7 |
| Oct. 10, 2019 | 310 | -26.6 C | -69.6 C | -102.2 C | 19.1 | 5 | 0.1 | SSE | 735.3 | 719.3 | 700.6 |
| Oct. 9, 2019 | 309 | -26.2 C | -65.9 C | -102.3 C | 18.9 | 5 | 0.2 | SSE | 735.4 | 718 | 702.5 |
| Oct. 8, 2019 | 308 | -25.6 C | -70.7 C | -102.1 C | 18.1 | 4.7 | 0.2 | SSE | 737.1 | 721.2 | 703.3 |
| Oct. 7, 2019 | 307 | -26.8 C | -75.4 C | -102 C | 18.4 | 4.2 | 0.2 | SSW | 739.7 | 724.2 | 704.6 |
| Oct. 6, 2019 | 306 | -25.7 C | -72.7 C | -102.7 C | 17.1 | 4.4 | 0.1 | SSE | 740.8 | 721.5 | 706.1 |
| Oct. 5, 2019 | 305 | -27.3 C | -71.2 C | -104.1 C | 22.2 | 5 | 0.1 | SSE | 738.4 | 722.5 | 708.7 |
| Oct. 4, 2019 | 304 | -25.9 C | -69 C | -104.3 C | 18.2 | 4.8 | 0.1 | SSE | 741.4 | 724.6 | 707.9 |
| Oct. 3, 2019 | 303 | -26.5 C | -67.1 C | -103.9 C | 19.1 | 4.9 | 0.1 | SSE | 741.7 | 724.2 | 711.3 |
| Oct. 2, 2019 | 302 | -25.3 C | -69 C | -102 C | 20.2 | 4.8 | 0.2 | SSE | 741.8 | 727.1 | 710.8 |
| Oct. 1, 2019 | 301 | -26.4 C | -69.7 C | -103.9 C | 17.9 | 4.6 | 0.1 | SE | 743.1 | 727.9 | 711.7 |
| Time | Air Temperature (°C) | Wind Speed (m/s) | Pressure (Pa) | ||||||||
|---|---|---|---|---|---|---|---|---|---|---|---|
| Date | Sol | Max | Avg | Min | Max | Avg | Min | Direction | Max | Avg | Min |
| Sep. 30, 2019 | 300 | -25.6 C | -68.9 C | -103.2 C | 22 | 5.1 | 0.1 | SSE | 745 | 729.3 | 711.3 |
| Sep. 29, 2019 | 299 | -27.7 C | -69.9 C | -101.3 C | 17.3 | 4.7 | 0.2 | SSE | 746.3 | 730.3 | 712.9 |
| Sep. 28, 2019 | 298 | -26.8 C | -75.6 C | -104.1 C | 17.9 | 4.1 | 0.1 | SW | 746.7 | 733.2 | 713.2 |
| Sep. 27, 2019 | 297 | -26.1 C | -71.1 C | -103.7 C | 18 | 4.6 | 0.1 | SSE | 748.6 | 732 | 713.2 |
| Sep. 26, 2019 | 296 | -26.4 C | -63.3 C | -102.9 C | 18.2 | 4.8 | 0.1 | SE | 748.7 | 730 | 715.3 |
| Sep. 25, 2019 | 295 | -26.6 C | -69.7 C | -102.1 C | 22.6 | 5.4 | 0.1 | SE | 751.2 | 733.9 | 716.2 |
| Sep. 24, 2019 | 294 | -24.8 C | -65 C | -100.4 C | 17.1 | 4.6 | 0.2 | SSE | 751.5 | 732.5 | 716.4 |
| Sep. 23, 2019 | 293 | -26.4 C | -61.6 C | -102 C | 19.1 | 5 | 0.2 | SSE | 753.5 | 738.2 | 718.2 |
| Sep. 22, 2019 | 292 | -26.4 C | -68.8 C | -101.2 C | 16.6 | 4.6 | 0.2 | SE | 753.6 | 739.3 | 718.9 |
| Sep. 21, 2019 | 291 | -26.5 C | -76.1 C | -103.4 C | 17.2 | 4.2 | 0.1 | W | 752.7 | 739.2 | 718.7 |
| Sep. 20, 2019 | 290 | -26.1 C | -67.5 C | -102.1 C | 17.5 | 4.6 | 0.1 | SE | 757.4 | 738.7 | 718.2 |
| Sep. 19, 2019 | 289 | -27.3 C | -73.4 C | -102.8 C | 17.4 | 4.2 | 0.1 | SW | 757.1 | 742.1 | 721.2 |
| Sep. 18, 2019 | 288 | -26.3 C | -73.7 C | -102.3 C | 17.7 | 4.3 | 0.2 | SW | 756.4 | 742.1 | 720.5 |
| Sep. 17, 2019 | 287 | -26 C | -67 C | -102.8 C | 16.8 | 4.3 | 0.1 | SSW | 758 | 741.8 | 723.7 |
| Sep. 16, 2019 | 286 | -26.5 C | -61.9 C | -101.2 C | 16.9 | 4.7 | 0.2 | SE | 759.1 | 742.2 | 724.5 |
| Sep. 15, 2019 | 285 | -27.1 C | -72.1 C | -100.8 C | 21.3 | 4.3 | 0.2 | SSW | 757.9 | 742 | 723.2 |
| Time | Air Temperature (°C) | Wind Speed (m/s) | Pressure (Pa) | ||||||||
|---|---|---|---|---|---|---|---|---|---|---|---|
| Date | Sol | Max | Avg | Min | Max | Avg | Min | Direction | Max | Avg | Min |
| Aug. 28, 2019 | 268 | -27.1 C | -69.9 C | -99.6 C | 15.9 | 4.6 | 0.2 | SSE | 769.4 | 749.6 | 733.8 |
| Aug. 27, 2019 | 267 | -27.5 C | -69.1 C | -101.5 C | - | - | - | n/a | 771 | 752.9 | 735.1 |
| Aug. 25, 2019 | 265 | -26.3 C | -65.2 C | -99.4 C | 16.1 | 5.3 | 0.2 | SSE | 774.1 | 754.6 | 733.4 |
| Aug. 24, 2019 | 264 | -26.7 C | -75.8 C | -101 C | 17.4 | 4.1 | 0.2 | SW | 775.3 | 759.3 | 738.4 |
| Aug. 23, 2019 | 263 | -27.2 C | -74.6 C | -100.9 C | 18.3 | 3.8 | 0.2 | SW | 776.4 | 760.1 | 738.4 |
| Aug. 22, 2019 | 262 | -26.4 C | -75.5 C | -101.3 C | 15.8 | 4.2 | 0.1 | SSE | 776.7 | 760.9 | 740.1 |
| Aug. 21, 2019 | 261 | -26.6 C | -78 C | -102.4 C | 16 | 4.8 | 0.2 | SW | 778.9 | 764.4 | 738.6 |
| Aug. 20, 2019 | 260 | -28.6 C | -75.9 C | -101.7 C | - | - | - | n/a | 777.8 | 762.5 | 741.1 |
| Aug. 19, 2019 | 259 | -27.1 C | -71.2 C | -101 C | 17.6 | 4.4 | 0.2 | SSW | 780.4 | 761 | 742.1 |
| Aug. 18, 2019 | 258 | -26.2 C | -65.5 C | -100 C | 16.8 | 4.7 | 0.2 | SSE | 779 | 759 | 741.6 |
| Aug. 17, 2019 | 257 | -26.5 C | -69.3 C | -100.2 C | 17.1 | 4.4 | 0.2 | SSE | 780.1 | 761 | 741.4 |
| Aug. 16, 2019 | 256 | -25.6 C | -70 C | -101.7 C | 17.9 | 4.2 | 0.1 | SW | 780.1 | 760.2 | 741.7 |
| Aug. 15, 2019 | 255 | -24.7 C | -69.3 C | -100.1 C | 17.3 | 4.5 | 0.2 | SSW | 780.5 | 762.5 | 744.1 |
| Aug. 14, 2019 | 254 | -25.9 C | -62.8 C | -99.3 C | 18.1 | 4.9 | 0.2 | SE | 781.6 | 758.3 | 739.2 |
| Aug. 13, 2019 | 253 | -25.5 C | -69.5 C | -100 C | 16.4 | 4.5 | 0.2 | SSE | 780.9 | 762.4 | 744 |
| Aug. 12, 2019 | 252 | -26 C | -73.7 C | -100.8 C | 18.3 | 4.2 | 0.1 | SSW | 781.6 | 763.6 | 744.4 |
| Aug. 11, 2019 | 251 | -26.5 C | -69.4 C | -101 C | 17.5 | 4.2 | 0.2 | SSE | 781.4 | 762.3 | 743 |
| Aug. 10, 2019 | 250 | -26.2 C | -72 C | -100 C | 16.2 | 4.3 | 0.2 | SSE | 781.2 | 762.3 | 743.7 |
| Aug. 9, 2019 | 249 | -26 C | -69.1 C | -98.8 C | 17.5 | 4.3 | 0.2 | SSE | 781.1 | 762.3 | 744.3 |
| Aug. 8, 2019 | 248 | -25.8 C | -71.2 C | -99.6 C | 16.7 | 4.5 | 0.2 | SSE | 781.2 | 763.2 | 743.7 |
| Aug. 7, 2019 | 247 | -26.5 C | -68.9 C | -100.4 C | 16.8 | 4.6 | 0.2 | SSE | 779.4 | 761.3 | 743.4 |
| Aug. 5, 2019 | 246 | -26.5 C | -64.9 C | -99.4 C | 18.1 | 5.3 | 0.2 | SSE | 0 | 0 | 0 |
| Aug. 4, 2019 | 245 | -25.6 C | -68.8 C | -99.9 C | 17.7 | 4.6 | 0.2 | SSE | 780.2 | 761.5 | 742.9 |
| Aug. 3, 2019 | 244 | -27.1 C | -70.2 C | -100.3 C | 15.9 | 4.4 | 0.2 | SSE | 783.1 | 763.5 | 742.9 |
| Aug. 2, 2019 | 243 | -25.9 C | -69.3 C | -99.8 C | 17.1 | 4.5 | 0.2 | SSE | 782 | 763.2 | 743.4 |
| Aug. 1, 2019 | 242 | -26.1 C | -69.1 C | -99.1 C | 17.1 | 4.7 | 0.2 | SW | 781.5 | 763.2 | 743.9 |
| Time | Air Temperature (°C) | Wind Speed (m/s) | Pressure (Pa) | ||||||||
|---|---|---|---|---|---|---|---|---|---|---|---|
| Date | Sol | Max | Avg | Min | Max | Avg | Min | Direction | Max | Avg | Min |
| July 31, 2019 | 241 | -26.2 C | -68.5 C | -100.5 C | 16.2 | 4.6 | 0.1 | SSE | 782.3 | 763.5 | 743.8 |
| July 30, 2019 | 240 | -25 C | -68.6 C | -98.5 C | 15.8 | 4.5 | 0.2 | SW | 781.9 | 763.4 | 743.5 |
| July 29, 2019 | 239 | -25.7 C | -68.3 C | -98 C | 20.4 | 5.3 | 0.2 | SW | 782.9 | 763.8 | 743.3 |
| July 23, 2019 | 233 | -25.7 C | -68.4 C | -98.8 C | 16.2 | 4.6 | 0.2 | SE | 780.8 | 764.3 | 744.1 |
| July 20, 2019 | 230 | -26.1 C | -68.3 C | -99.3 C | 15.2 | 4 | 0.2 | SE | 781.8 | 764.5 | 744.1 |
| July 19, 2019 | 229 | -24.7 C | -68.2 C | -99.2 C | 14.8 | 4 | 0.2 | SW | 782 | 763.9 | 743.4 |
| July 18, 2019 | 228 | -25 C | -68.8 C | -98.7 C | 14.5 | 4.2 | 0.2 | SSE | 782.5 | 764.7 | 742.3 |
| July 17, 2019 | 227 | -25.4 C | -68.6 C | -100 C | 15 | 4.2 | 0.2 | SE | 781.9 | 764.7 | 742.1 |
| July 16, 2019 | 226 | -25.9 C | -68.3 C | -98 C | 14.8 | 4.1 | 0.2 | SSW | 782.2 | 764.5 | 740.7 |
| July 15, 2019 | 225 | -25 C | -68.2 C | -98.3 C | 15 | 4.2 | 0.2 | SE | 782.6 | 764.6 | 741.3 |
| July 14, 2019 | 224 | -25.8 C | -69.4 C | -100.8 C | 14.8 | 4.2 | 0.1 | SSE | 782.9 | 764.8 | 741.4 |
| July 13, 2019 | 223 | -25.5 C | -69.1 C | -100.8 C | 17.4 | 4.3 | 0.2 | SE | 781.5 | 764.2 | 740.8 |
| July 12, 2019 | 222 | -24.8 C | -68.9 C | -99.7 C | 15.6 | 4.2 | 0.2 | SSE | 781.1 | 764 | 739.8 |
| July 11, 2019 | 221 | -23.8 C | -69.7 C | -99.4 C | 14.1 | 4.1 | 0.2 | SSE | 780.3 | 763.6 | 739.1 |
| July 10, 2019 | 220 | -25.9 C | -70.4 C | -101.2 C | 16 | 4 | 0.2 | SSE | 780.4 | 763.7 | 738.5 |
| July 9, 2019 | 219 | -24.9 C | -68.8 C | -100.3 C | 16.1 | 4.5 | 0.2 | SE | 782.6 | 764.9 | 739.9 |
| July 8, 2019 | 218 | -26.1 C | -69.2 C | -100.2 C | 16 | 4.6 | 0.2 | SE | 779.7 | 764.2 | 741.2 |
| July 6, 2019 | 216 | -24.9 C | -65.4 C | -102.5 C | 15.8 | 4.6 | 0.1 | SSE | 780.2 | 762 | 739.3 |
| July 5, 2019 | 215 | -25 C | -69 C | -101.7 C | 14.6 | 4.2 | 0.1 | SSE | 781.7 | 764.1 | 740.3 |
| July 4, 2019 | 214 | -24.7 C | -68.9 C | -101.2 C | 14.5 | 4.2 | 0.2 | SSE | 779.7 | 762.7 | 738.2 |
| July 3, 2019 | 213 | -25.2 C | -69 C | -102.1 C | 15.1 | 4 | 0.1 | WSW | 779.3 | 761.6 | 736.4 |
| July 2, 2019 | 212 | -24.2 C | -64.9 C | -102.1 C | 15.7 | 4.3 | 0.1 | SSE | 781.4 | 761.5 | 737.2 |
| July 1, 2019 | 211 | -24.3 C | -68.5 C | -101 C | 15.4 | 4.3 | 0.1 | SSW | 782.7 | 762.9 | 738.1 |
| Time | Air Temperature (°C) | Wind Speed (m/s) | Pressure (Pa) | ||||||||
|---|---|---|---|---|---|---|---|---|---|---|---|
| Date | Sol | Max | Avg | Min | Max | Avg | Min | Direction | Max | Avg | Min |
| June 29, 2019 | 210 | -25.4 C | -68.6 C | -101 C | 15.6 | 4.4 | 0.1 | SE | 781.6 | 762.4 | 737.4 |
| June 28, 2019 | 209 | -23.7 C | -69 C | -103 C | 15.5 | 4.3 | 0.1 | SSE | 778.3 | 761.1 | 737.6 |
| June 27, 2019 | 208 | -23.7 C | -68.7 C | -102.3 C | 15.4 | 4.3 | 0.1 | SSE | 777.5 | 761.6 | 739.5 |
| June 26, 2019 | 207 | -25 C | -69.2 C | -103.9 C | 15.8 | 4.3 | 0.1 | SE | 778 | 762.9 | 740.2 |
| June 25, 2019 | 206 | -25.3 C | -65.4 C | -103.5 C | 15.6 | 4.8 | 0.1 | SE | 775.4 | 760.1 | 740.1 |
| June 24, 2019 | 205 | -24.9 C | -69.6 C | -103.9 C | 15.9 | 4.3 | 0.1 | SSE | 775.3 | 760.6 | 739 |
| June 23, 2019 | 204 | -25.3 C | -69.7 C | -104.1 C | 15.3 | 4.3 | 0.1 | W | 775.8 | 761.4 | 739.7 |
| June 22, 2019 | 203 | -25.7 C | -72.9 C | -104 C | 14.6 | 4 | 0.1 | SSE | 775.8 | 761.9 | 739.4 |
| June 21, 2019 | 202 | -24.4 C | -69.6 C | -103.3 C | 15.4 | 4.4 | 0.1 | SSE | 775.1 | 760.2 | 739.2 |
| June 20, 2019 | 201 | -24 C | -69.7 C | -103.3 C | 16.1 | 4.2 | 0.1 | SSE | 775.3 | 759.7 | 738.1 |
| June 19, 2019 | 200 | -24.6 C | -70.1 C | -104.3 C | 15.6 | 4.2 | 0.1 | SSE | 777.3 | 760.2 | 738.2 |
| June 18, 2019 | 199 | -23.2 C | -70.5 C | -104.7 C | 14.9 | 4.1 | 0.1 | W | 775.2 | 759.8 | 737.4 |
| June 17, 2019 | 198 | -24.7 C | -70 C | -104.8 C | 15.5 | 4 | 0.1 | SSE | 774.5 | 758.3 | 735.6 |
| June 16, 2019 | 197 | -23.3 C | -69.7 C | -105.2 C | 15.9 | 4.1 | 0.1 | SSE | 775.2 | 758.1 | 735.9 |
| June 15, 2019 | 196 | -22.3 C | -70 C | -105.3 C | 15.9 | 4.4 | 0.1 | W | 775.6 | 759.1 | 737.5 |
| June 14, 2019 | 195 | -23.8 C | -69.9 C | -105.6 C | 14.5 | 4.3 | 0.1 | SSE | 776.9 | 759.5 | 738.3 |
| June 13, 2019 | 194 | -23.5 C | -69.5 C | -104.4 C | 17 | 4.5 | 0.1 | SSE | 774.1 | 757.3 | 738.1 |
| June 12, 2019 | 193 | -23 C | -69.6 C | -103.7 C | 35.1 | 9.8 | 0.3 | SSE | 774.8 | 757.2 | 737.3 |
| June 11, 2019 | 192 | -23.6 C | -65.9 C | -104.9 C | 15.4 | 5 | 0.1 | SSE | 775.2 | 758.9 | 739.6 |
| June 10, 2019 | 191 | -21.6 C | -69.6 C | -104.9 C | 15.2 | 4.4 | 0.1 | SSE | 775.2 | 758.7 | 740.4 |
| June 9, 2019 | 190 | -22.5 C | -69.3 C | -104.1 C | 16.6 | 5.2 | 0.2 | SSE | 772.5 | 757.4 | 739.5 |
| June 8, 2019 | 189 | -22.4 C | -69.4 C | -102.2 C | 16.5 | 4.7 | 0.2 | SSE | 773.6 | 756.6 | 738.9 |
| June 7, 2019 | 188 | -21.9 C | -65.2 C | -102.5 C | 15.6 | 4.8 | 0.1 | SSE | 772.4 | 757.3 | 738 |
| June 6, 2019 | 187 | -21.9 C | -68.6 C | -102.8 C | 16.1 | 4.4 | 0.2 | SSE | 774.6 | 757.4 | 735.4 |
| June 5, 2019 | 186 | -21.8 C | -68.4 C | -101.7 C | 16.2 | 4.6 | 0.2 | SSE | 772.1 | 755.9 | 733.5 |
| June 4, 2019 | 185 | -21.2 C | -68.4 C | -100.7 C | 15.3 | 4.5 | 0.2 | W | 771.7 | 755.1 | 732.3 |
| June 3, 2019 | 184 | -22.1 C | -68.7 C | -101.3 C | 15.2 | 4.5 | 0.2 | W | 771.8 | 755.3 | 730.9 |
| June 2, 2019 | 183 | -22.3 C | -63 C | -101.1 C | 15.2 | 4.9 | 0.2 | SSE | 773.3 | 757.1 | 731.2 |
| June 1, 2019 | 182 | -22.6 C | -51.3 C | -99.7 C | 15.9 | 5.7 | 0.2 | SSE | 772.4 | 753.9 | 730.7 |
| Time | Air Temperature (°C) | Wind Speed (m/s) | Pressure (Pa) | ||||||||
|---|---|---|---|---|---|---|---|---|---|---|---|
| Date | Sol | Max | Avg | Min | Max | Avg | Min | Direction | Max | Avg | Min |
| May 31, 2019 | 181 | -20.7 C | -63.8 C | -100.6 C | 14.9 | 5.1 | 0.2 | SW | 770.2 | 753 | 729.8 |
| May 30, 2019 | 180 | -21.8 C | -64.3 C | -101.1 C | 14.7 | 4.7 | 0.2 | S | 769.8 | 752.4 | 729.1 |
| May 29, 2019 | 179 | -21.5 C | -63.9 C | -101 C | 14.5 | 4.8 | 0.2 | SW | 772.4 | 754.5 | 729.9 |
| May 28, 2019 | 178 | -23 C | -64 C | -101.1 C | 15 | 4.9 | 0.2 | SW | 771.3 | 752.2 | 728.6 |
| May 27, 2019 | 177 | -21.3 C | -63.7 C | -100.7 C | 17.1 | 4.8 | 0.2 | SW | 769 | 751.8 | 727.5 |
| May 26, 2019 | 176 | -19.9 C | -68 C | -100.3 C | 15.9 | 4.2 | 0.2 | W | 770.2 | 751.6 | 727.1 |
| May 23, 2019 | 174 | -21.3 C | -67.6 C | -101.1 C | 16.3 | 4.3 | 0.2 | SW | 770.2 | 751.7 | 728.2 |
| May 22, 2019 | 173 | -20.9 C | -63.7 C | -100.9 C | 14.1 | 4.9 | 0.2 | SW | 769.2 | 751.1 | 726.2 |
| May 22, 2019 | 172 | -20 C | -65 C | -133.5 C | - | - | - | n/a | 769.5 | 749.6 | 726.8 |
| May 20, 2019 | 171 | -20.9 C | -63.7 C | -100.5 C | 14.8 | 4.9 | 0.2 | SW | 769.6 | 751.7 | 727.7 |
| May 19, 2019 | 170 | -21.2 C | -63.4 C | -100.9 C | 14.6 | 4.7 | 0.2 | SW | 767.1 | 749.4 | 726.8 |
| May 18, 2019 | 169 | -17.6 C | -67.8 C | -100.6 C | 15.5 | 4.6 | 0.2 | S | 768 | 748.9 | 724.9 |
| May 17, 2019 | 168 | -19.6 C | -63.6 C | -100.5 C | 12.6 | 4.6 | 0.2 | SW | 768.1 | 745.7 | 724.6 |
| May 16, 2019 | 167 | -20.4 C | -65.1 C | -100.5 C | 13.5 | 4.7 | 0.5 | SW | 769.2 | 751.8 | 724.7 |
| May 15, 2019 | 166 | -20.5 C | -63.8 C | -100.5 C | 11.7 | 4.6 | 0.2 | SSE | 769.2 | 749.2 | 725.6 |
| May 14, 2019 | 165 | -18.2 C | -65.7 C | -100.3 C | 13.7 | 4.6 | 0.6 | SW | 767.8 | 750.5 | 725.7 |
| May 13, 2019 | 164 | -16.6 C | -63.8 C | -100 C | 15.1 | 4.4 | 0.2 | SW | 766.4 | 747.6 | 725 |
| May 12, 2019 | 163 | -17.7 C | -64.2 C | -99.9 C | 15.2 | 4.3 | 0.3 | SW | 766.2 | 746.7 | 724.8 |
| May 11, 2019 | 162 | -20.3 C | -67.9 C | -100.2 C | 14.3 | 4.1 | 0.2 | WNW | 766.3 | 747 | 724.9 |
| May 10, 2019 | 161 | -19.5 C | -67.5 C | -98.6 C | 15.2 | 4.2 | 0.2 | W | 765.2 | 746.1 | 722.8 |
| May 9, 2019 | 160 | -19.4 C | -63.7 C | -99.5 C | 13.5 | 4.6 | 0.2 | SSE | 765 | 745.1 | 721.2 |
| May 8, 2019 | 159 | -21.6 C | -67.9 C | -100.3 C | 15.3 | 4.2 | 0.2 | W | 765.4 | 744.7 | 720 |
| May 7, 2019 | 158 | -21.8 C | -64.8 C | -99.7 C | 13.6 | 4.8 | 0.8 | SSE | 765.4 | 746.2 | 719.8 |
| May 6, 2019 | 157 | -18.4 C | -67.4 C | -100.2 C | 14.6 | 4.1 | 0.2 | W | 764.9 | 743.5 | 719.5 |
| May 5, 2019 | 156 | -18.1 C | -63.5 C | -99.2 C | 13.8 | 4.7 | 0.2 | SW | 763.6 | 743.5 | 719.7 |
| May 4, 2019 | 155 | -18.8 C | -63.4 C | -99.3 C | 14.3 | 4.5 | 0.2 | SW | 762.8 | 742 | 720.7 |
| May 3, 2019 | 154 | -17.2 C | -63.5 C | -97.6 C | 13.1 | 4.5 | 0.2 | SW | 763 | 743.3 | 719.9 |
| May 2, 2019 | 153 | -17.5 C | -63.5 C | -98.5 C | - | - | - | n/a | 762.2 | 743.1 | 719.7 |
| May 1, 2019 | 152 | -17.2 C | -63.3 C | -98.1 C | 13.2 | 4.8 | 0.2 | SW | 760.8 | 741.9 | 717.8 |
| Time | Air Temperature (°C) | Wind Speed (m/s) | Pressure (Pa) | ||||||||
|---|---|---|---|---|---|---|---|---|---|---|---|
| Date | Sol | Max | Avg | Min | Max | Avg | Min | Direction | Max | Avg | Min |
| Apr. 30, 2019 | 151 | -17.5 C | -67.1 C | -97.1 C | 12.3 | 4.1 | 0.2 | W | 761.6 | 741.2 | 717.9 |
| Apr. 29, 2019 | 150 | -20.4 C | -63.8 C | -98.5 C | 14.4 | 4.6 | 0.3 | SW | 760.8 | 741.1 | 717.6 |
| Apr. 28, 2019 | 149 | -19.5 C | -63.4 C | -98.8 C | 14.2 | 4.6 | 0.2 | SW | 760 | 739 | 716.1 |
| Apr. 27, 2019 | 148 | -18.2 C | -67.1 C | -99.1 C | 14.3 | 4.2 | 0.2 | W | 761.1 | 739.1 | 714.7 |
| Apr. 26, 2019 | 147 | -23.5 C | -74.7 C | -98.4 C | 11.7 | 3.7 | 0.2 | W | 762 | 740.8 | 714.7 |
| Apr. 25, 2019 | 146 | -17.7 C | -64.6 C | -98.6 C | 11.6 | 4.8 | 0.5 | SW | 761.2 | 741.3 | 714.9 |
| Apr. 24, 2019 | 145 | -19.3 C | -65.1 C | -98.1 C | 11.6 | 4.4 | 0.2 | SW | 762.1 | 739.3 | 716 |
| Apr. 23, 2019 | 144 | -17.6 C | -64.4 C | -98.7 C | 11.1 | 4.2 | 0.2 | SW | 760 | 737.5 | 714.5 |
| Apr. 22, 2019 | 143 | -19.8 C | -63.3 C | -98 C | 12.1 | 4.6 | 0.2 | SW | 758.9 | 736.4 | 713.2 |
| Apr. 21, 2019 | 142 | -18.4 C | -66.8 C | -97.5 C | 14.8 | 4.2 | 0.2 | W | 758.3 | 735.9 | 712.3 |
| Apr. 20, 2019 | 141 | -19.7 C | -64 C | -98.3 C | 12.9 | 4.7 | 0.5 | SW | 758.8 | 737.1 | 712.6 |
| Apr. 19, 2019 | 140 | -18 C | -69.2 C | -98.6 C | 14.2 | 4 | 0.2 | W | 758.8 | 735.2 | 712.2 |
| Apr. 18, 2019 | 139 | -18.1 C | -62.9 C | -97.6 C | 12.2 | 4.7 | 0.3 | SW | 757.5 | 734.1 | 708.9 |
| Apr. 17, 2019 | 138 | -17.3 C | -65.5 C | -97.7 C | 12.6 | 4.3 | 0.2 | W | 756.8 | 733.6 | 709.2 |
| Apr. 15, 2019 | 137 | -15.9 C | -64.7 C | -97 C | 12.4 | 4.3 | 0.2 | SW | 754.6 | 732.7 | 709 |
| Apr. 14, 2019 | 136 | -16.5 C | -65.9 C | -97.3 C | 10.8 | 4.3 | 0.3 | WNW | 754.4 | 732.4 | 708.5 |
| Apr. 13, 2019 | 135 | -16.6 C | -65.8 C | -96.5 C | 11.3 | 4.2 | 0.2 | SW | 754.2 | 732.8 | 709.7 |
| Apr. 12, 2019 | 134 | -18.2 C | -62.5 C | -98.4 C | - | - | - | n/a | 755.7 | 731.1 | 708.4 |
| Apr. 11, 2019 | 133 | -15.7 C | -65.8 C | -96.8 C | 11.7 | 4.2 | 0.2 | W | 754.2 | 731.3 | 706.8 |
| Apr. 10, 2019 | 132 | -16.3 C | -65.9 C | -97.7 C | 12.2 | 4.3 | 0.2 | SW | 752.8 | 730.8 | 706.9 |
| Apr. 9, 2019 | 131 | -15.6 C | -66 C | -98.2 C | 11.6 | 4.1 | 0.2 | WNW | 752.9 | 731.1 | 707.3 |
| Apr. 8, 2019 | 130 | -15.5 C | -65.8 C | -98 C | 11.7 | 4.1 | 0.2 | SW | 752.4 | 731.2 | 707.7 |
| Apr. 7, 2019 | 129 | -16.7 C | -65.9 C | -97.7 C | 11.9 | 4.1 | 0.2 | SW | 752.2 | 730.2 | 707 |
| Apr. 6, 2019 | 128 | -15.5 C | -65.3 C | -97.5 C | 13.6 | 4.1 | 0.2 | SW | 750.6 | 719.1 | 707.4 |
| Apr. 5, 2019 | 127 | -16.8 C | -65.5 C | -96.6 C | 11.2 | 4.2 | 0.3 | SW | 751.4 | 730.3 | 707.5 |
| Apr. 4, 2019 | 126 | -17 C | -65.1 C | -97 C | 10.7 | 4 | 0.2 | SW | 750.5 | 730.2 | 707.5 |
| Apr. 3, 2019 | 125 | -16.8 C | -65.5 C | -97.2 C | 11.7 | 4 | 0.2 | SW | 749.8 | 729.4 | 706.2 |
| Apr. 2, 2019 | 124 | -16.7 C | -65.9 C | -97.9 C | 11.8 | 4 | 0.2 | SW | 750.3 | 728.6 | 705.6 |
| Time | Air Temperature (°C) | Wind Speed (m/s) | Pressure (Pa) | ||||||||
|---|---|---|---|---|---|---|---|---|---|---|---|
| Date | Sol | Max | Avg | Min | Max | Avg | Min | Direction | Max | Avg | Min |
| Mar. 28, 2019 | 119 | -15 C | -60.9 C | -97.4 C | 10.1 | 4.3 | 0.2 | SW | 750.3 | 728.2 | 704.5 |
| Mar. 24, 2019 | 115 | -15.5 C | -61.6 C | -96 C | - | - | - | n/a | 750.7 | 725.5 | 700.6 |
| Mar. 23, 2019 | 114 | -15.5 C | -65 C | -96.8 C | - | - | - | n/a | 749.2 | 725.5 | 700.9 |
| Mar. 22, 2019 | 113 | -15.3 C | -64.6 C | -96.7 C | - | - | - | n/a | 748.7 | 724 | 700.4 |
| Mar. 17, 2019 | 108 | -14.4 C | -50.3 C | -96.1 C | 13.1 | 5.2 | 0.3 | SW | 750.4 | 724.8 | 697.5 |
| Mar. 16, 2019 | 107 | -15.8 C | -64.6 C | -96.1 C | 10.4 | 4.1 | 0.2 | SW | 749.4 | 723.5 | 697.7 |
| Mar. 15, 2019 | 106 | -15.9 C | -64.5 C | -96.3 C | 12.4 | 4.1 | 0.2 | WNW | 751.2 | 724.9 | 698.5 |
| Mar. 14, 2019 | 105 | -14.7 C | -64.3 C | -95.7 C | 12.1 | 4 | 0.2 | SW | 748.5 | 724.7 | 698.4 |
| Mar. 13, 2019 | 104 | -14.4 C | -64.1 C | -96.1 C | 11.1 | 4.2 | 0.2 | WNW | 748 | 723.7 | 697.1 |
| Mar. 12, 2019 | 103 | -19.1 C | -61.1 C | -95.8 C | 14 | 4.9 | 0.2 | WNW | 748.6 | 724.2 | 697.3 |
| Mar. 11, 2019 | 102 | -17 C | -64.2 C | -96.8 C | 12.7 | 4.6 | 0.4 | SW | 749.4 | 725.2 | 697.4 |
Temperature Over Time
I have adjusted the chart to display only data up to and including sol 814. There were large gaps in the data after that, and the data was probably unreliable. The period represented covers March 11th 2019 through to March 10th 2021, so 2 Earth years, and a little over a Martian year.
Horizontal lines indicate maximum and minimum values after smoothing out anomolies
Vertical lines indicate:
SE (spring equinox), SS (summer solstice), AE (autumn equinox), WS (winter solstice)
AP (aphelion - furthest distance from the sun), PE (perihelion - closest approach to the sun)
MSC (Mars Solar Conjunction - Earth and Mars on opposite sides of the Sun)
CVI (Covid-19 related interruption to datastream)
| Temperature Records since March 11th 2019 | |||||||||
|---|---|---|---|---|---|---|---|---|---|
| °C | Lowest | Highest | Range | Current | °F | Lowest | Highest | Range | Current |
| Max | Max | ||||||||
| Avg | Avg | ||||||||
| Min | Min | ||||||||
Data in the above chart is derived after smoothing out spikes and troughs with a ≥±10°C or greater deviance.
Current Time in Elysium
The lander is in the south-west corner of Elysium Planitia, approximately 135°E 4.5°N. The Martian day - or sol - is 24hrs 39mins 35secs long. For convenience, Martian clocks keep a 24hr time, requiring the Martian second to be a little longer than it is on Earth (approx 1.0275 secs).
These clocks reflect the local times at the prime meridian and InSight's location and keep Martian time (using its extended seconds). InSight was intended to land at 135.974°E, but actually landed at 135.6234°E. The InSight Clock uses the actual landing site, while the Mission Clock (used by the mission team) uses the intended landing site.
LS is the solar longitude - the angular position of the planet from the vernal equinox - and is important in many equations, particularly regarding time and dates. The value displayed here differs from that at James Tauber's Mars Clock, which itself differs from the value displayed by Mars24. I had to choose one of them as my benchmark, and since I use Mars24 as the benchmark for the clocks, it seemed reasonable to choose Mars24 to remain consistent. The difference between the two (Mars24 and Tauber's algorithm) is only 0.00628° anyway, but otherwise they are in lock-step.
Although LS effectively describes the planet's position in its orbit around the sun, it is actually a function of time on the planetary analemma, since it describes the position on the analemma for a certain date and time.
MSD is the Martian equivalent of a Julian date, and this refers to the number of sols since Dec 29th 1873. For obvious reasons, this keeps Martian time. Note: if you use the Mars24 program, you may note the MSD displayed in that program differs slightly from this one. It seems Mars24 rounds the numbers, so when MSD reaches a 0.005 precision boundary, it rounds up. It doesn't seem to do this for MJD.
MJD is the Modified Julian Date. This ignores the first 2,400,000 days in the standard Julian date, and moves the starting point to midnight (from midday). This is further modified to reflect the coordinated universal time for spacecraft, which is some 5hrs 45m adrift of UTC.
Since MSD uses Martian time and MJD uses universal time, you'll see them slide in and out of synchronicity.
There are several Martian Calendars in use. NASA uses MSD, but the year/month calculations in the above clocks use the calendar proposed by R. Todd Clancy (Clancy et al., Journal of Geophys. Res 105, p 9553, 2000), whereby the Calendar begins at midnight on the morning of April 11th 1955 (when Ls = 0) and with the first year being year 1.
Martian years are approx. 686 days long, equating to roughly 668 sols. Sols are counted from the start of the year because of the huge variance in the length of Martian months. Martian months vary in duration from 46 to 67 sols.
Martian months are calculated based on the number of degrees Mars is around its orbit (each month being 30°). This means most months end partway through the day. In order to ensure a month consists of whole days, the calculation employed here rounds down to the nearest whole number. Therefore, if the end of the month occurs on sol 68.2, all of sol 68 occurs in the last day of the month. This is a convenience, and there is no formal convention on how to handle this. Other calculators may begin a month on any day where the month begins, so in the above example, sol 68 may be the first sol in the new month.
If you are wondering why the sols on the clocks don't match the sols in the weather reports, the weather reports refer to mission time, rather than the start of the Martian year. Besides being a convenient way to track mission duration, it guarantees two data points in different years have unique sol counts.
In addition, the weather report in the graphic at the top of the page is usually a few days in arrears. The Sol counter in the mission clock reports the current mission date.
Current Location of Mars
[1] the calculation is based on data from the Planetary Society, and divides the Martian year using the equinoxes and solstices. Further, it uses UTC to perform the calculations rather than Airy Mean Time (AMT), so is only an approximation to provide a rough guide. AMT is the Martian equivalent of GMT. The Martian year is 686.97 standard days (668.6 sols), approximately 1.88 years.
[2] Calculation is based on data from Goddard Institute for Space Studies
[3] Calculation is based on data from Goddard Institute for Space Studies and other sources
 Image courtesy of https://in-the-sky.org and © Dominic Ford
This image is updated once per week. A daily update is available on the Mars Solar Conjunctions page when such events are active.
You can check the position of Mars vs the Sun and Earth for any date here:
https://in-the-sky.org/solarsystem.php?obj=P4
Discussion