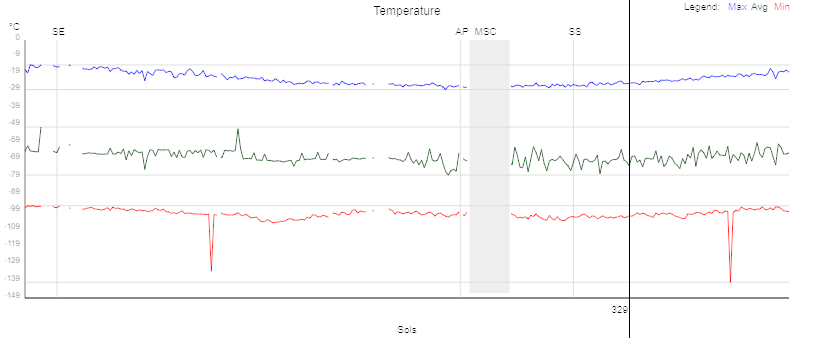
Mars Weather Page Update
 I've updated the format of the Temperature Over Time chart on the Mars Weather page to make it more readable. The sol numbers were overlapping each other, despite being broken into two rows. The chart is now interactive, in that you can use your mouse (or other pointing device) to select a position on one of the temperature graphs, and the sol number will be displayed at the bottom.
There are about 9 months worth of data at the time I write this (on the 1st Jan 2020), and each data point is currently separated by two pixels (and occupying a third). This means that in about eighteen months time, the metrics will go into sub-pixel resolution. I'll update the graph again before then so all the data can be displayed and easily reviewed.